Below, please find the Broadway Grosses for Week Ending May 18, 2025, courtesy of KGM.
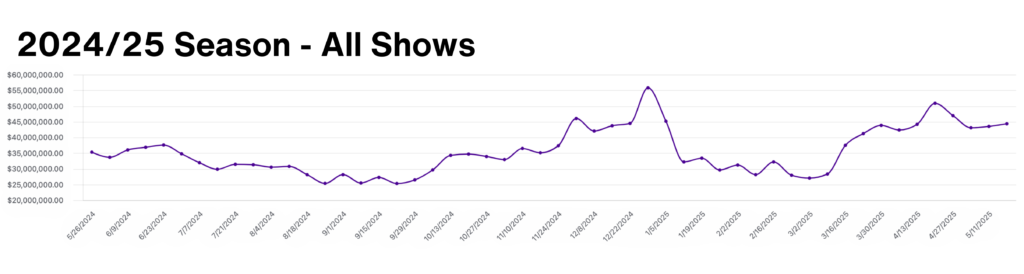
This week there were a total of 40 shows grossing $44,351,676.
Of the 377,341 seats available for purchase on Broadway this week, 336,494 or 89.2% were filled.
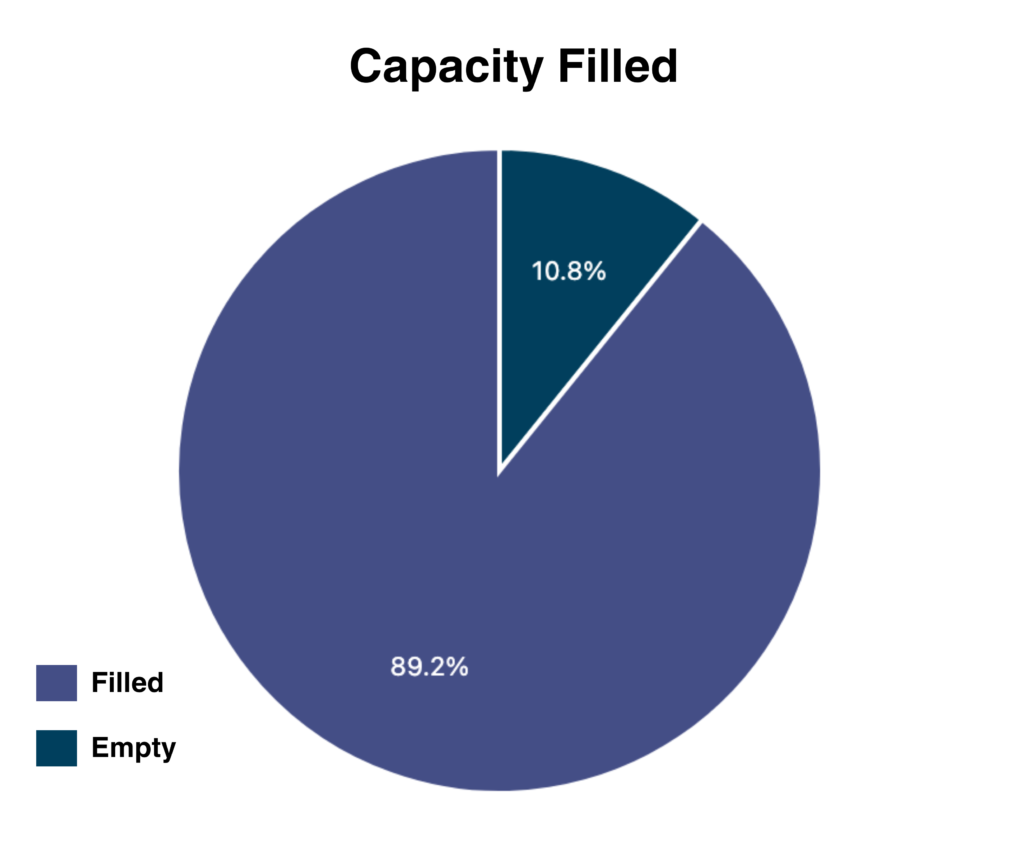
89.2% total capacity filled this week.
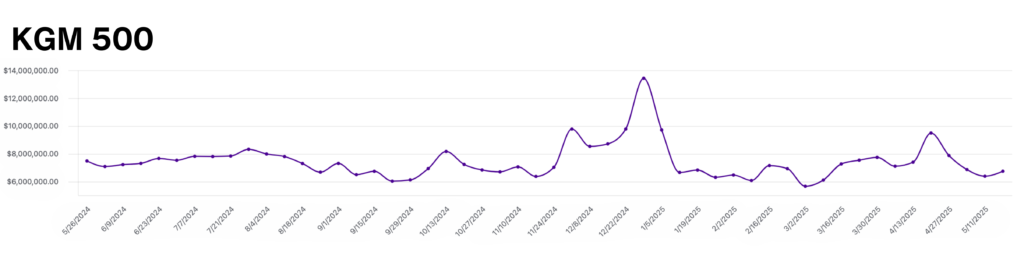
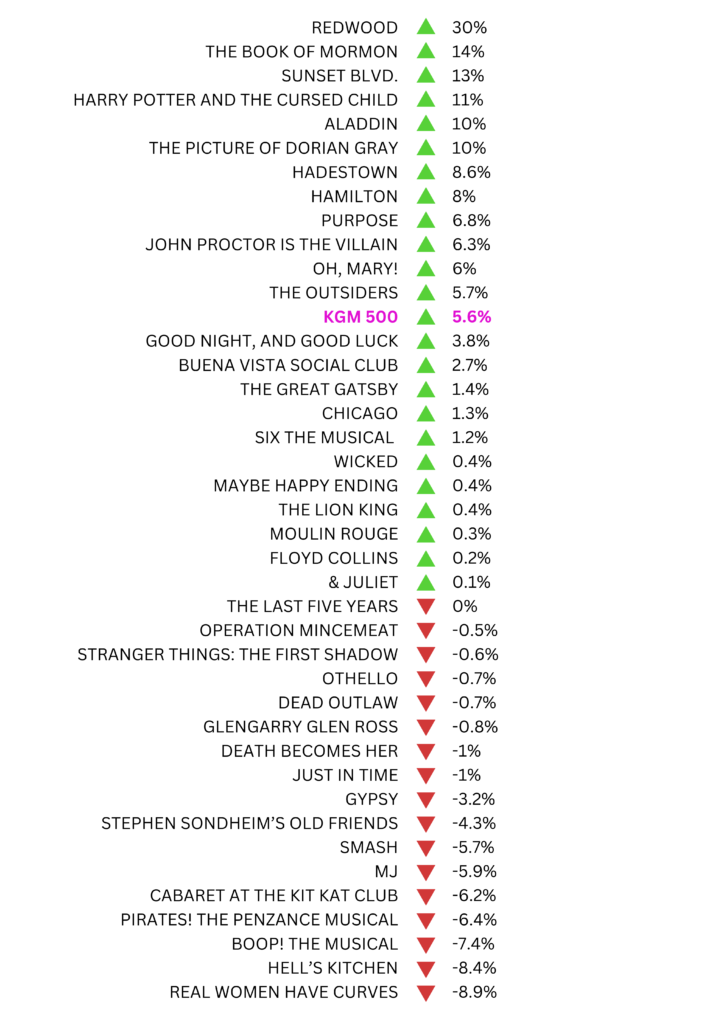
The KGM 500 is a Broadway market index used to track the overall health of the market based on the grosses of 5 long-running shows. This week, the KGM 500 rose to $6,735,156, a 5.6% increase from last week’s grosses. With 40 productions currently running on Broadway, the competition is steep, and new musicals that haven’t been Tony-nominated are in a particularly precarious spot. Below, you’ll find a metric to track each show’s performance in relation to the benchmark of the KGM 500.
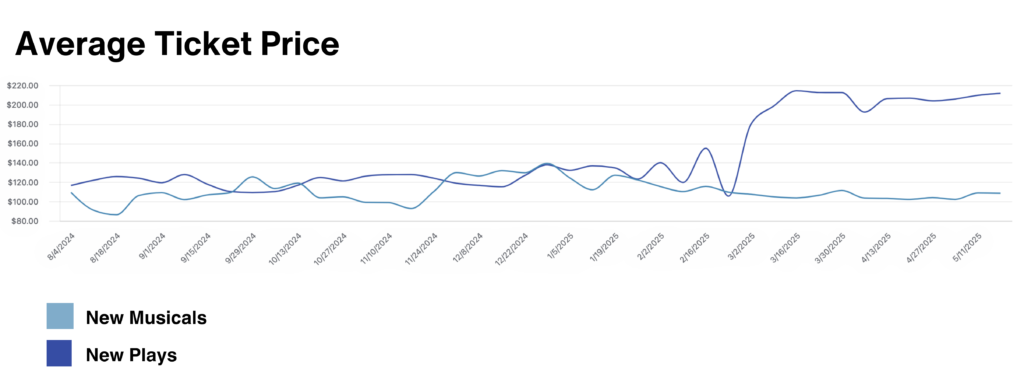
The Average Ticket Price graph shows a comparison of ATP for new musicals and plays that opened in the 2024/25 season. This week, ATP for new musicals remained at a modest $108.52, while ATP for new plays rose to $211.75. For the tenth week in a row, the new plays in the 24/25 season have out-grossed the new musicals.
Data provided by The Broadway League Research Department.
Want to receive our exclusive box-office analysis to your inbox each week? Sign up below!
