Below, please find the Broadway Grosses for Week Ending October 12, 2025, courtesy of KGM.
Stay tuned to the end of this week’s newsletter for the latest upload to our YouTube series on producing in NYC!
This week there were a total of 31 shows grossing $39,416,736.
Of the 293,798 seats available for purchase on Broadway this week, 276,625 or 94.2% were filled.
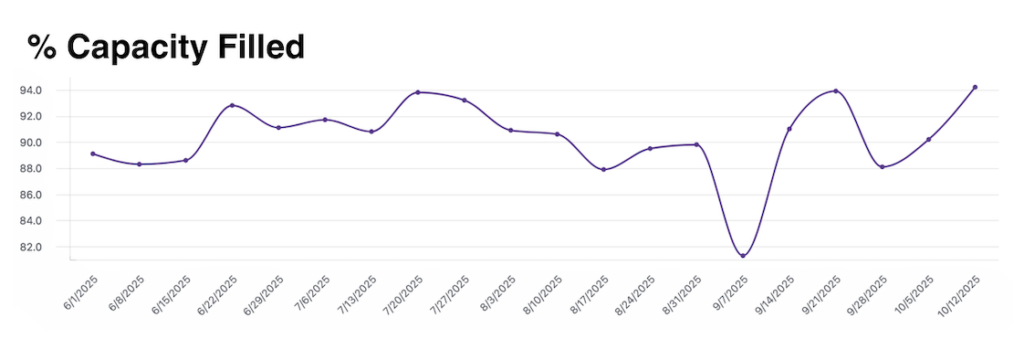 94.2% total Broadway capacity filled this week.
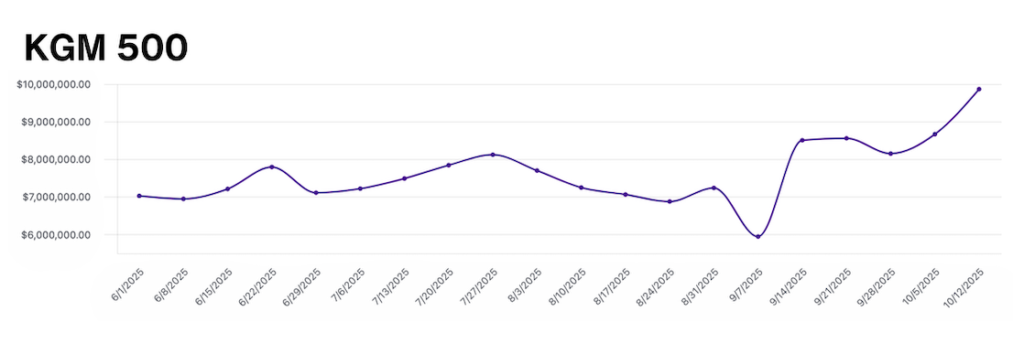
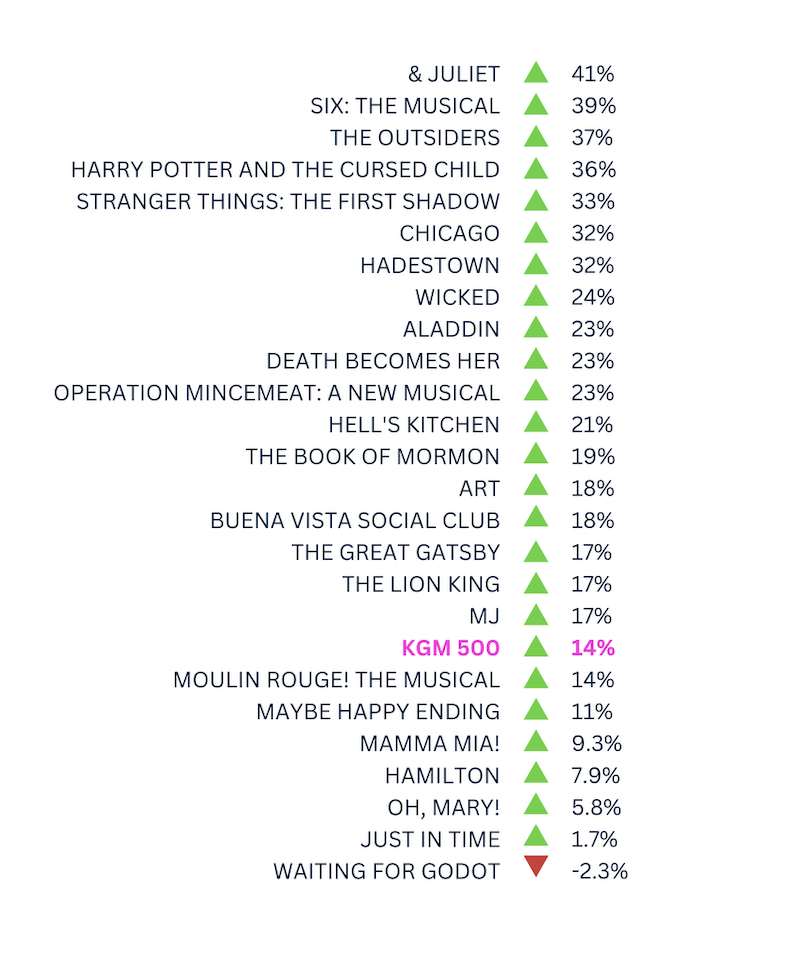
The KGM 500 is a Broadway market index used to track the overall health of the market based on the grosses of 5 long-running shows. This week, Broadway saw the highest attendance rates of the 25/26 season thus far. Between the 3-day holiday weekend, and new shows opening up left and right, audiences were packed in this week, with 28 of the 31 shows playing to houses above 80% capacity. Below, you’ll find a metric to track each show’s performance in relation to the benchmark of the KGM 500.
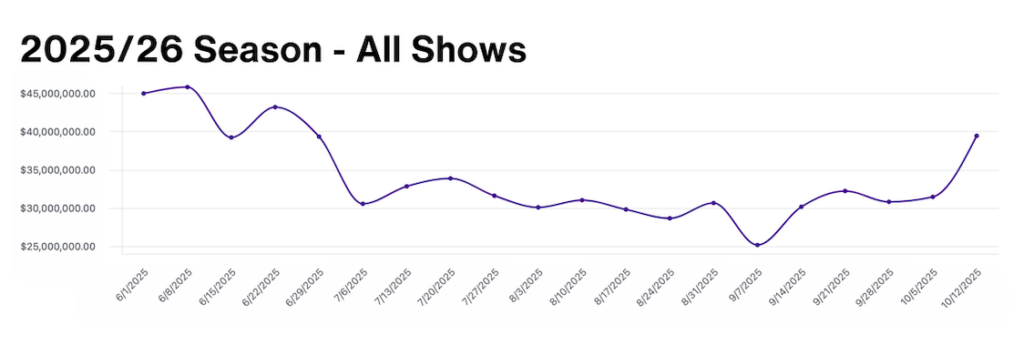
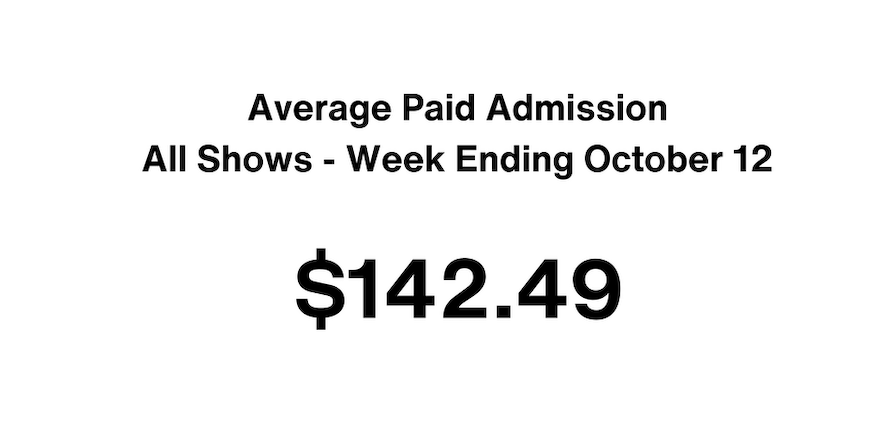
This week, the average paid admission across all Broadway shows rose to $142.49, a 6.3% increase from last week’s average.
Data provided by The Broadway League Research Department.
Ever wonder how investors actually make money on Broadway? Watch this video where Daniel Kuney breaks down the process of how Broadway investors earn back their initial investment, and when they start seeing profits.
Want to receive our exclusive box office analysis directly to your inbox each week? Sign up below!
