Below, please find the Broadway Grosses for Week Ending June 29, 2025, courtesy of KGM.
This week there were a total of 35 shows grossing $39,314,834.
Of the 327,106 seats available for purchase on Broadway this week, 298,509 or 91.1% were filled.
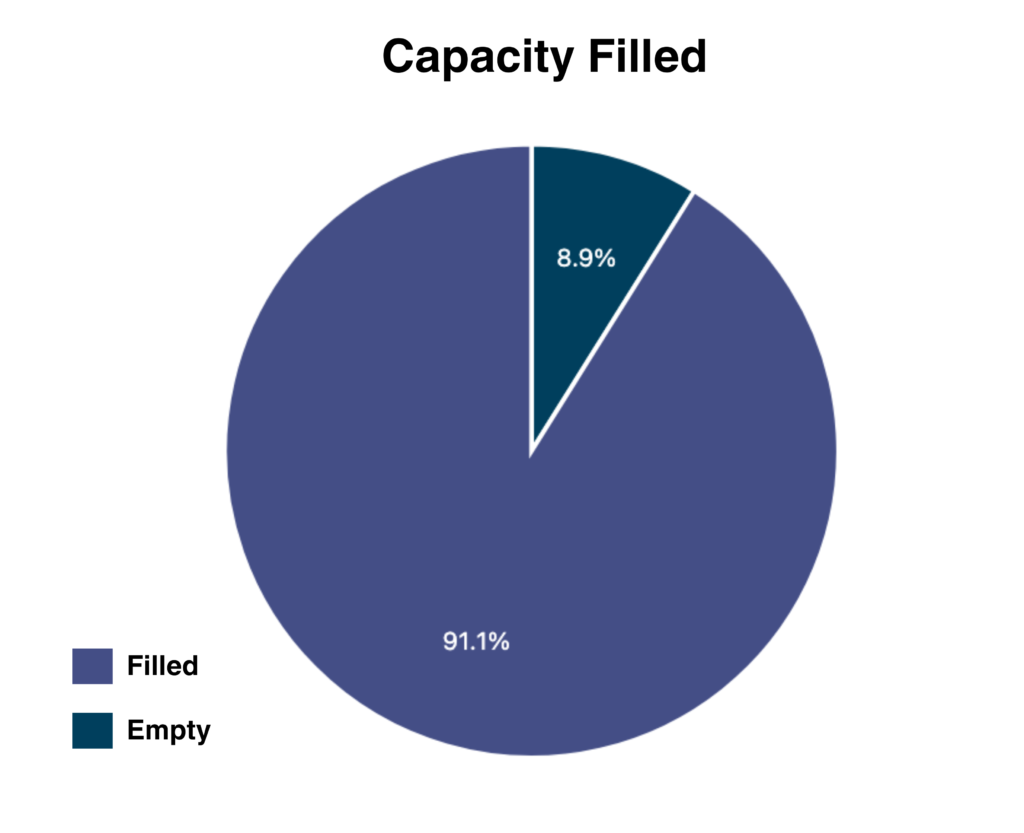
91.1% total capacity filled this week.
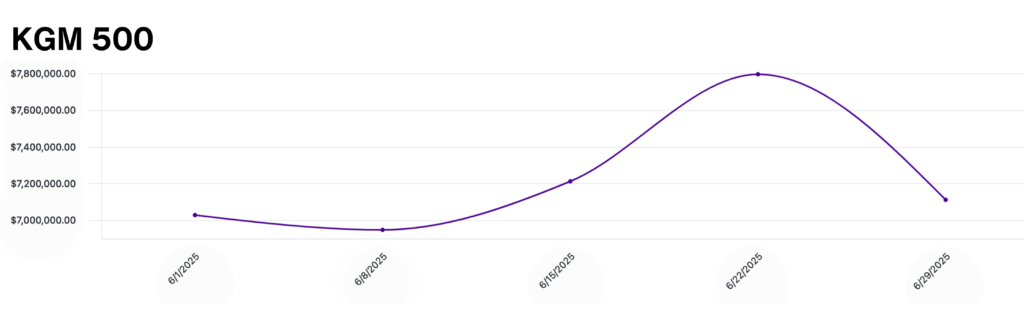
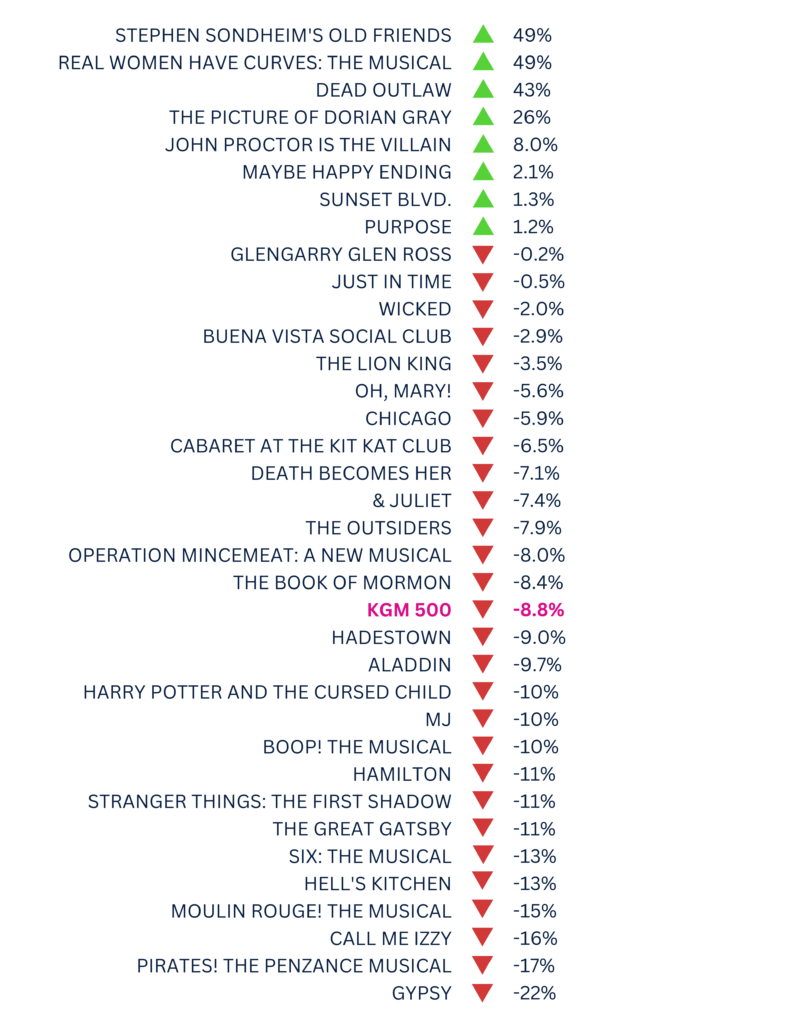
The KGM 500 is a Broadway market index used to track the overall health of the market based on the grosses of 5 long-running shows. This week, the KGM 500 dipped to $7,111,038, an 8.8% decrease from the previous week. The overall grosses sunk proportionally this week, with an 8.9% decrease. The closure of several shows, the annual post-Tony’s slump, and New Yorkers beginning to leave the city for the summer are all contributing factors to the dip in the overall grosses as we head into the holiday weekend. Below, you’ll find a metric to track each show’s performance in relation to the benchmark of the KGM 500.
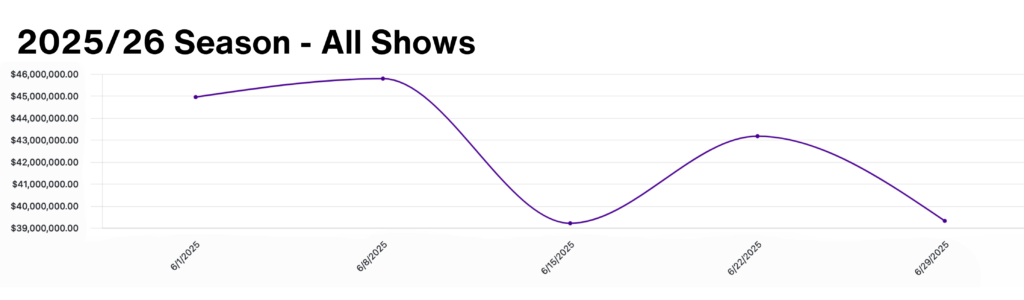
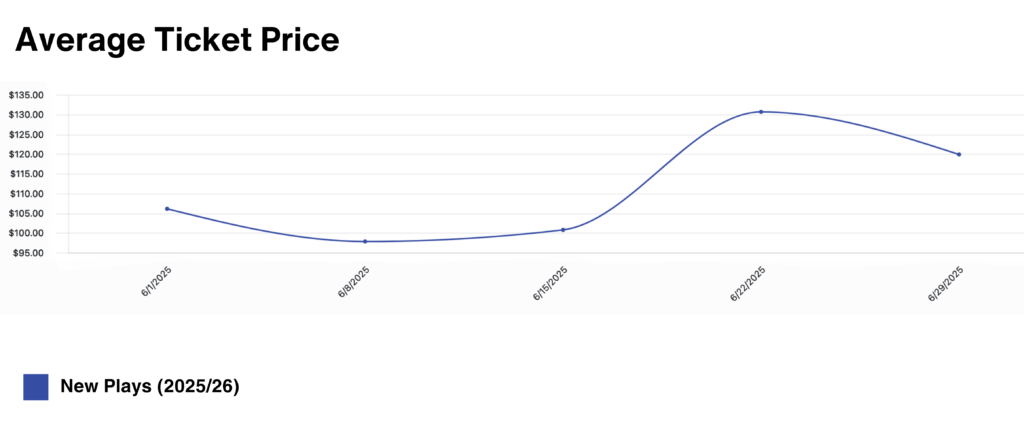
The Average Ticket Price graph shows the ATP for new plays that opened in the 2025/26 season. This week, ATP for new plays dipped slightly to $119.87, an 8.3% decrease from the previous week.
Data provided by The Broadway League Research Department.
