Below, please find the Broadway Grosses for Week Ending July 20, 2025, courtesy of KGM.
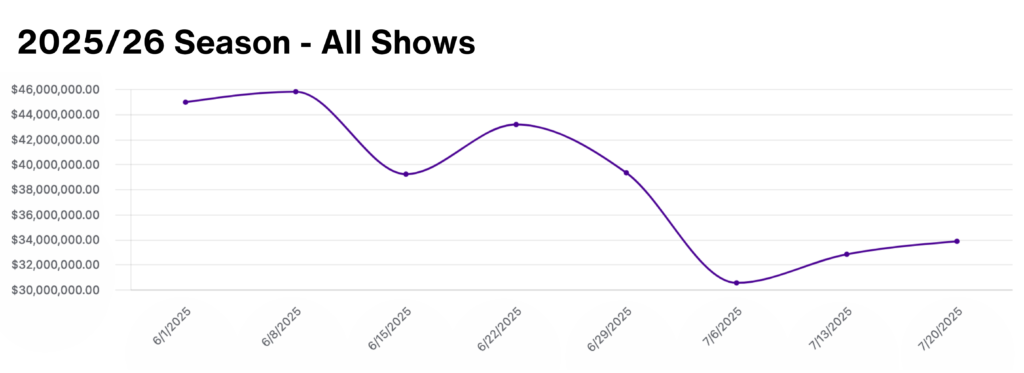
This week there were a total of 29 shows grossing $33,847,950.
Of the 274,740 seats available for purchase on Broadway this week, 257,595 or 93.8% were filled.
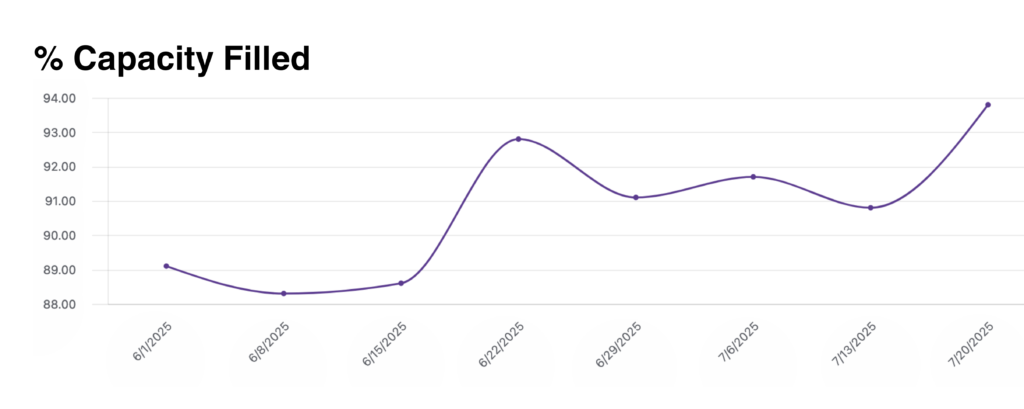
93.8% total Broadway capacity filled this week.
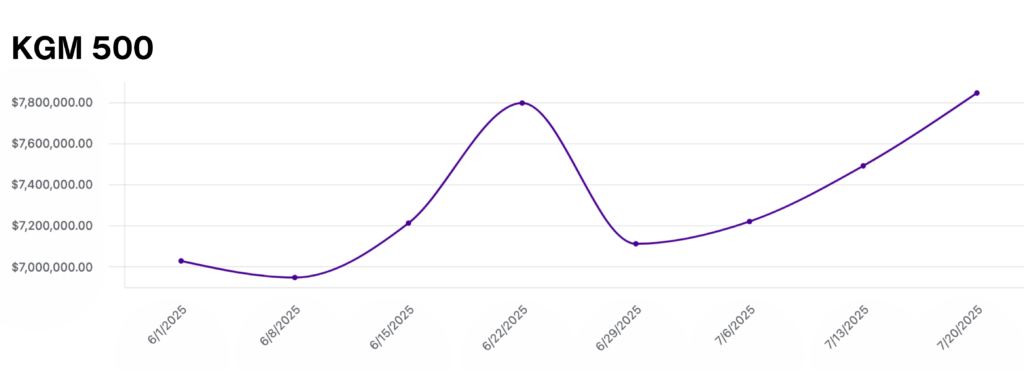
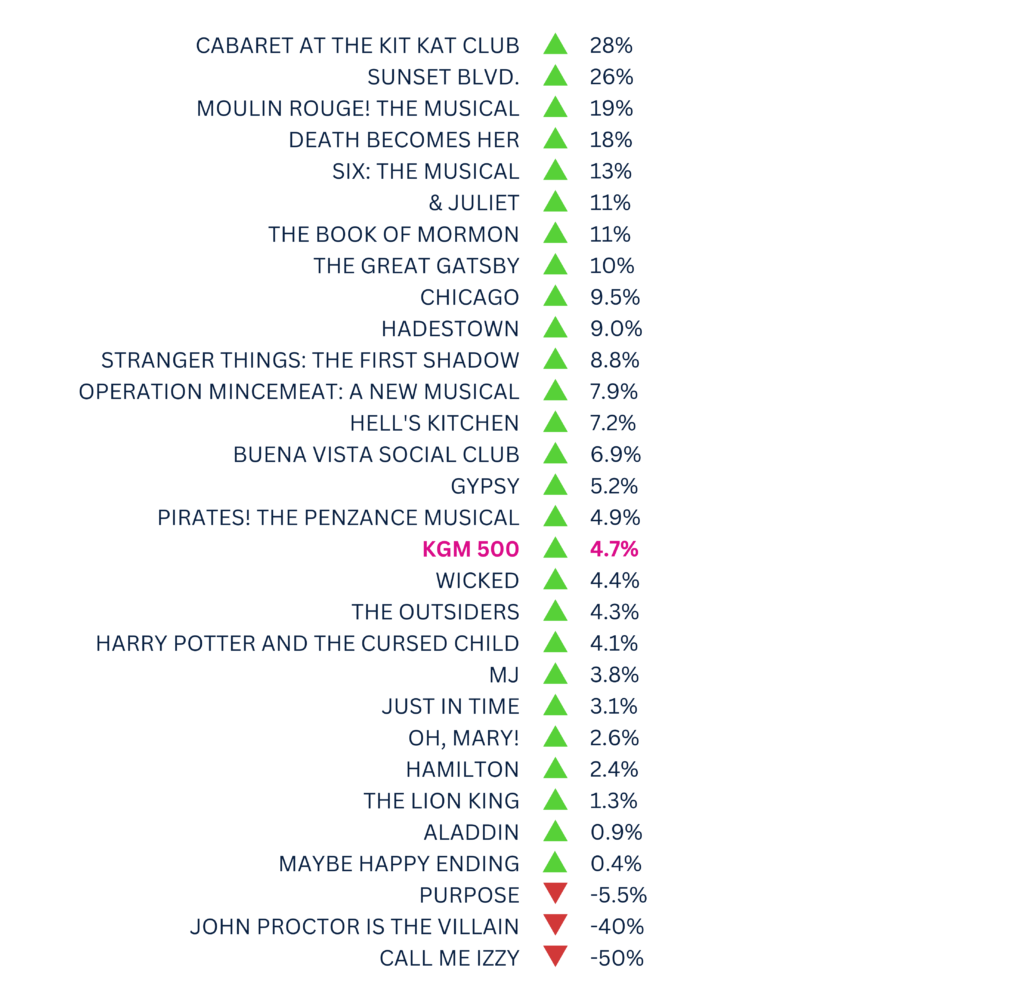
The KGM 500 is a Broadway market index used to track the overall health of the market based on the grosses of 5 long-running shows. This week, the KGM 500 rose to $7,843,446, a 4.7% increase from the previous week. Comparing this trend line to the total season’s grosses, we can see that the legacy shows are experiencing a boost that is stronger than the market average, likely due to the increased summer tourism. Below, you’ll find a metric to track each show’s performance in relation to the benchmark of the KGM 500.
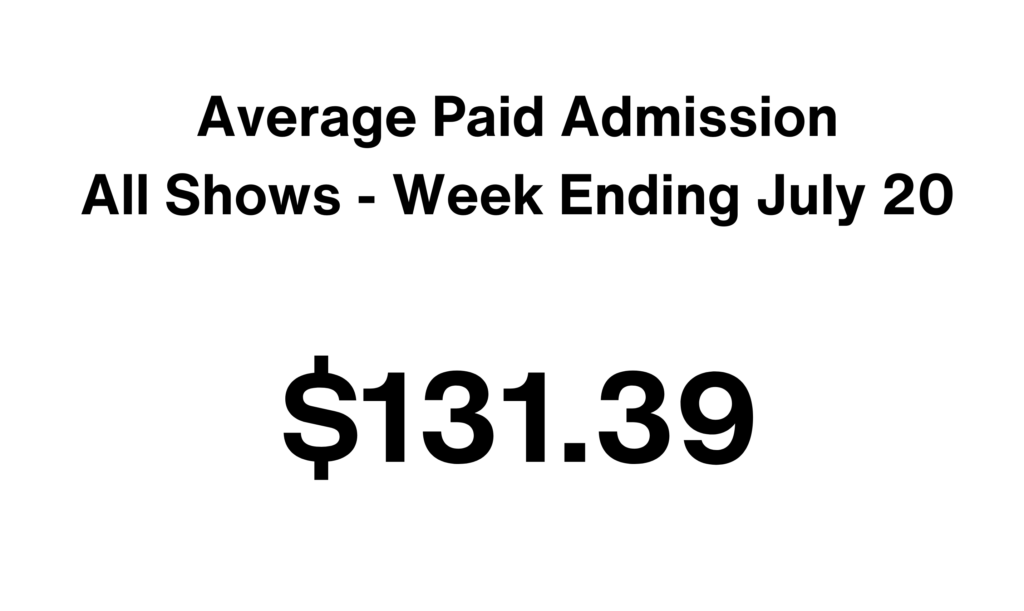
This week, the average paid admission across all Broadway shows rose to $131.39, a 5% increase from last week’s average.
Data provided by The Broadway League Research Department.
Want to receive our exclusive box office analysis to your inbox each week? Sign up below!
