Please find below the Broadway Grosses for Week Ending February 16, 2025, courtesy of KGM.
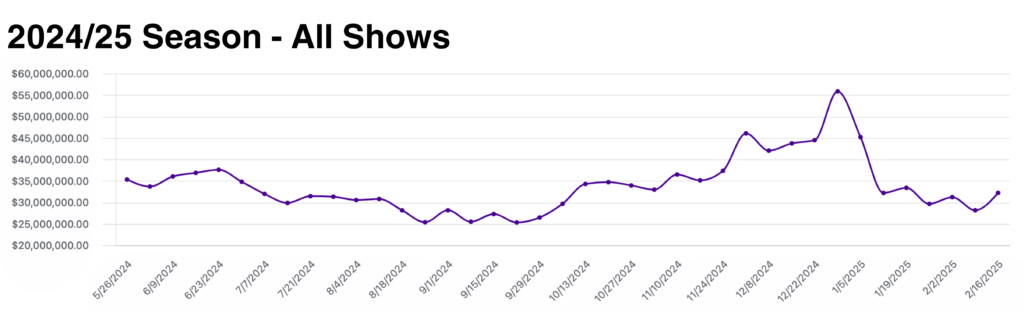
This week there were a total of 28 shows grossing $32,188,003.
Of the 263,640 seats available for purchase on Broadway this week, 243,319 or 92.3% were filled.
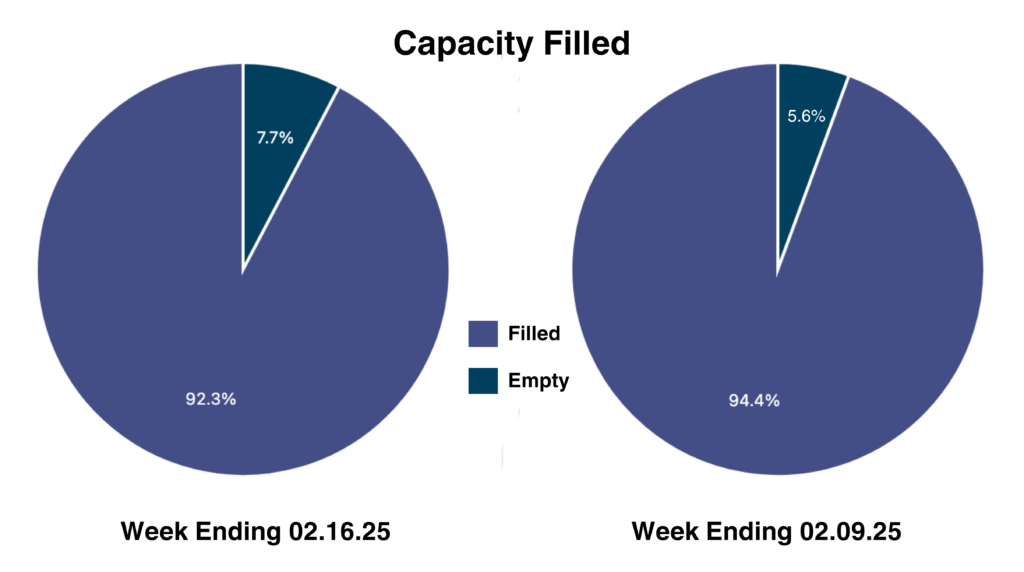
92.3% capacity filled, versus 94.4% last week.
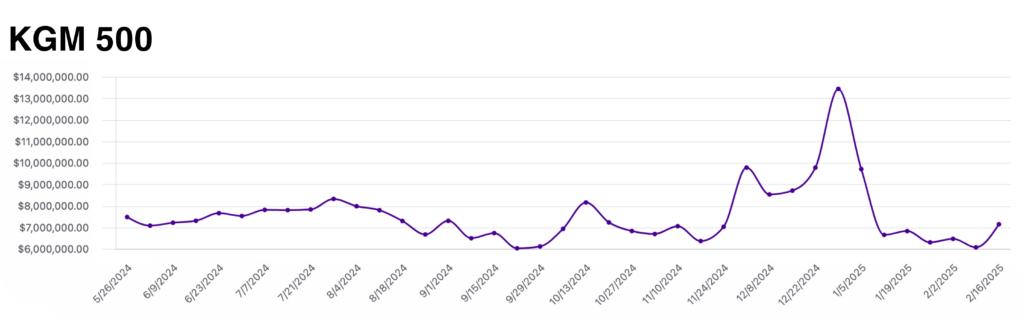
The KGM 500 is a Broadway market index used to track the overall health of the market based on the grosses of 5 long-running shows. This week, the KGM 500 rose to $7,139,488, marking a comeback for the legacy shows after a traditionally low January. Domestic tourism over the federal holiday, New York public schools going on break, and the end of the Broadway week 2-for-1 discounts are all likely contributing factors in the bump in grosses this past week.
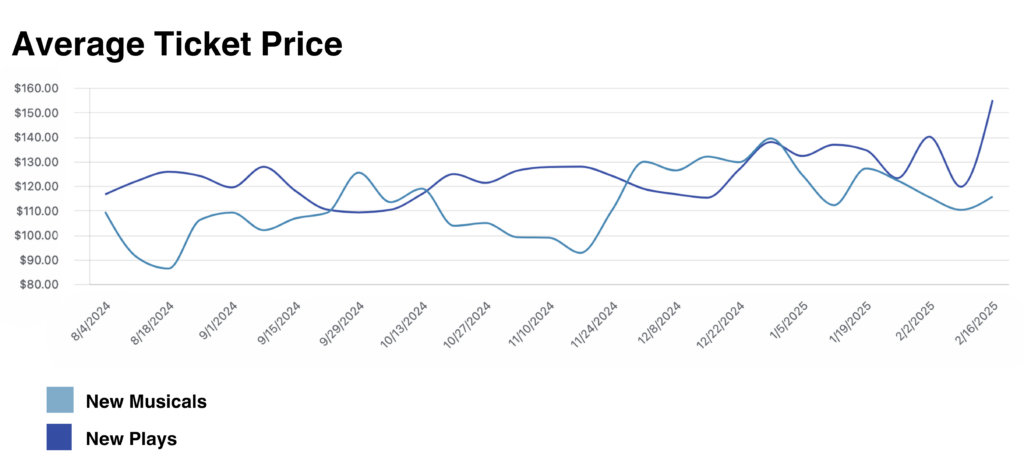
The Average Ticket Price graph shows a comparison of ATP for new musicals and plays that opened in the 2024/25 season. This week, ATP for new musicals rose slightly to $115.66, while ATP for new plays skyrocketed to $155.03 during the final week of both All In: A Comedy About Love and the starry revival of Romeo + Juliet.
Recently, we introduced the Producing in NY Slack Community: a place to ask questions and share knowledge about all things related to producing live entertainment in NYC. Have a question about budgets, a union rule, or just a show recommendation, this is your community.
