Below, please find the Broadway Grosses for Week Ending April 6, 2025, courtesy of KGM.
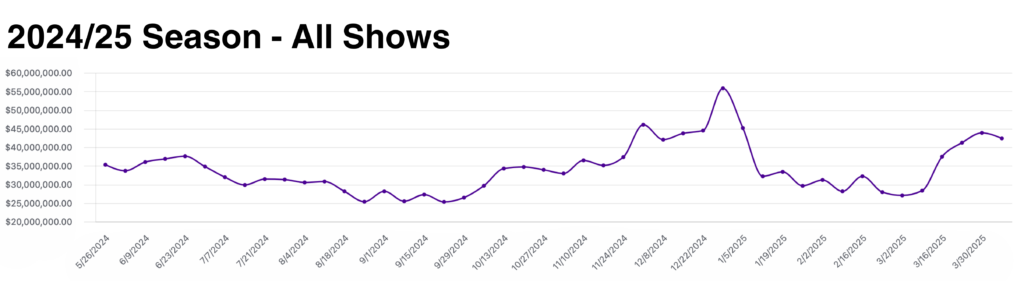
This week there were a total of 39 shows grossing $42,361,129.
Of the 354,945 seats available for purchase on Broadway this week, 322,960 or 90.9% were filled.
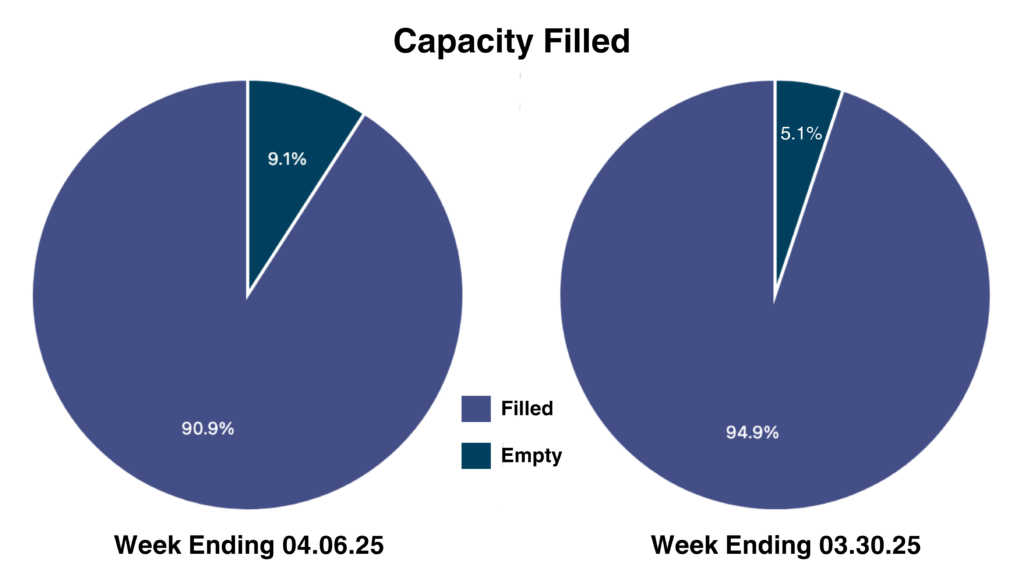
90.9% capacity filled this week versus 94.9% filled last week.
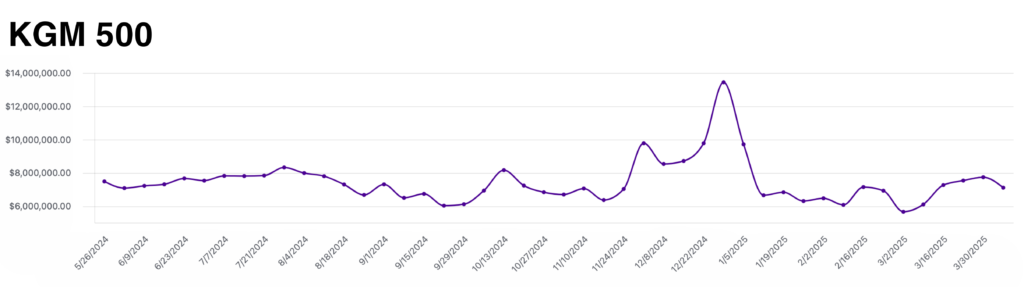
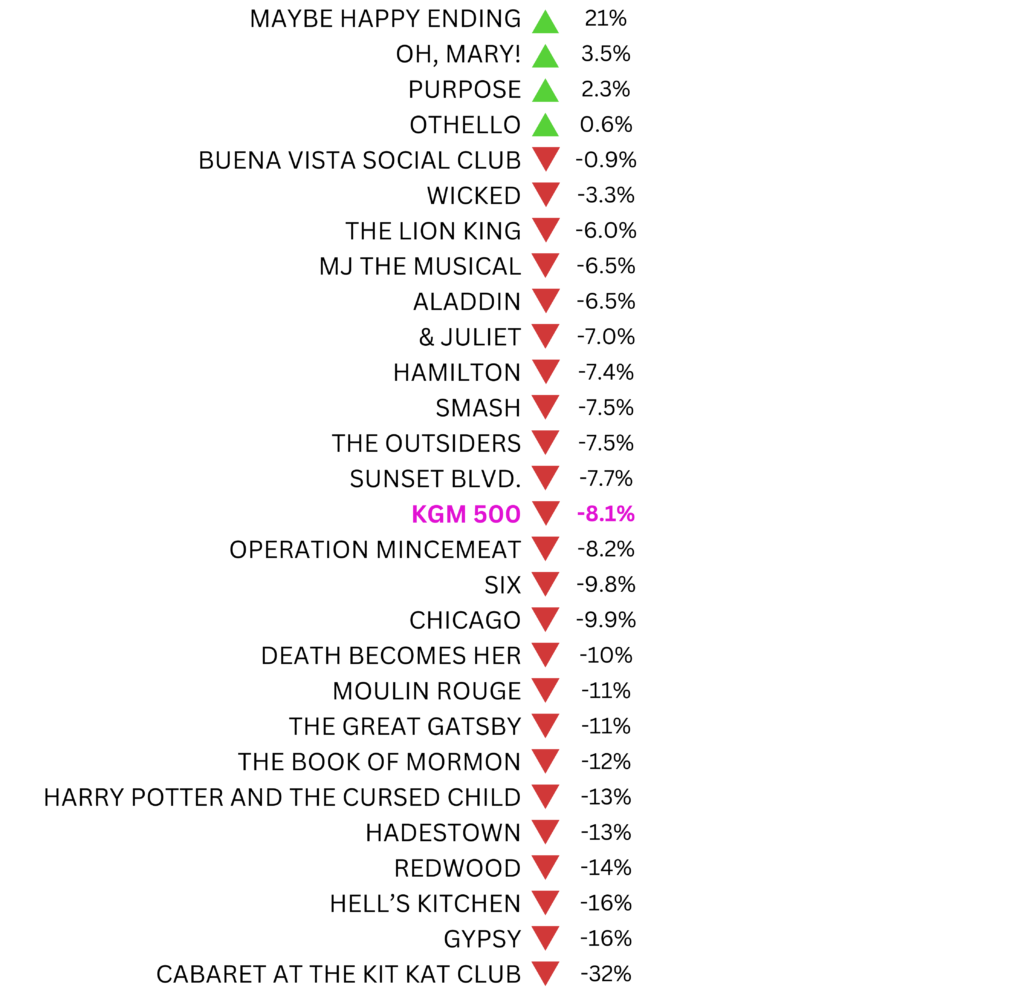
The KGM 500 is a Broadway market index used to track the overall health of the market based on the grosses of 5 long-running shows. This week, the KGM 500 dropped to $7,100,647, an 8.1% decrease from last week’s grosses. Almost every show on Broadway was down this week, with the exceptions of Maybe Happy Ending, Oh, Mary!, Purpose, and Othello. According to a Financial Times article posted last week there are, “early signs that an influx of tourists boycotting the US will add to the crowds flocking to the West End for hit shows.” [Read the full article here]. While the Broadway market was down this week, grosses this week were still 7.3% higher compared to this week last season. Below, you’ll find a metric to track each show’s performance in relation to the benchmark of the KGM 500.
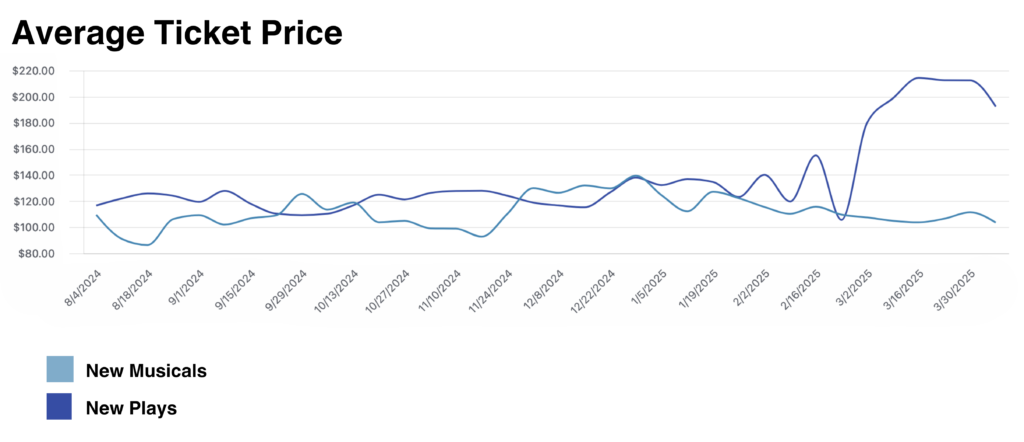
The Average Ticket Price graph shows a comparison of ATP for new musicals and plays that opened in the 2024/25 season. This week, ATP for new musicals dipped to $103.55, while ATP for new plays came down to $192.38. For the fourth week in a row, the now 8 new plays in the 24/25 season have out-grossed the now 15 new musicals in the 24/25 season.
Data provided by The Broadway League Research Department.
If you’d like to receive our exclusive box-office analysis to your inbox each week, sign up below!
