Below, please find the Broadway Grosses for Week Ending April 27, 2025, courtesy of KGM.
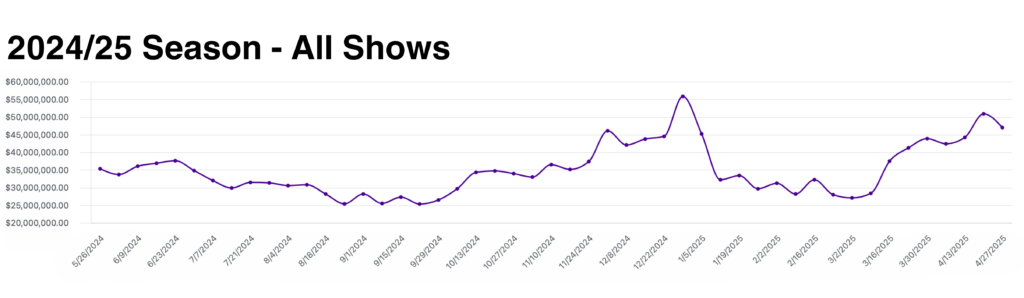
This week there were a total of 40 shows grossing $46,949,262.
Of the 373,911 seats available for purchase on Broadway this week, 345,165 or 92.3% were filled.
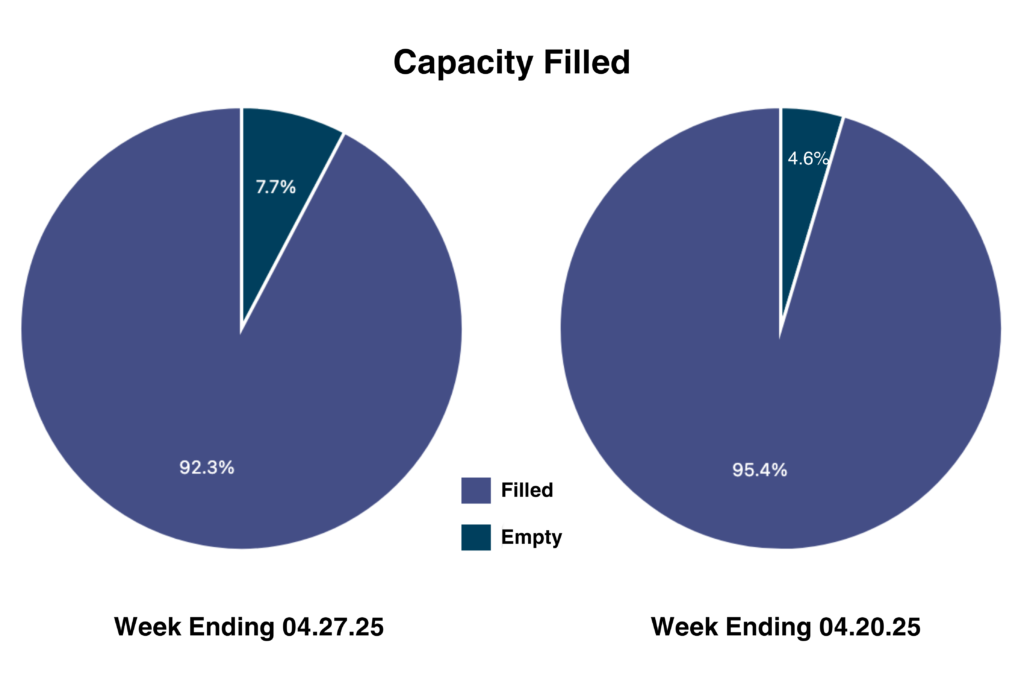
92.3% capacity filled this week, versus 95.4% last week.
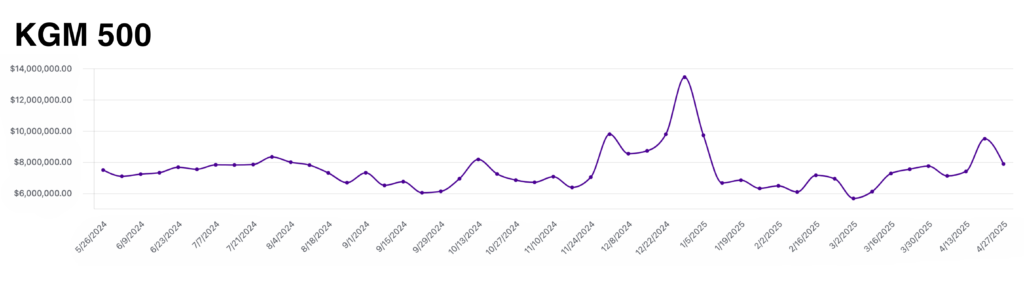
The KGM 500 is a Broadway market index used to track the overall health of the market based on the grosses of 5 long-running shows. This week, the KGM 500 dipped to $7,866,091, a 17% decrease from last week’s grosses. While legacy shows such as The Lion King and Harry Potter took a significant hit this week, newer openings in the 24/25 Tony season saw less audience drop-off. Below, you’ll find a metric to track each show’s performance in relation to the benchmark of the KGM 500.
![]()
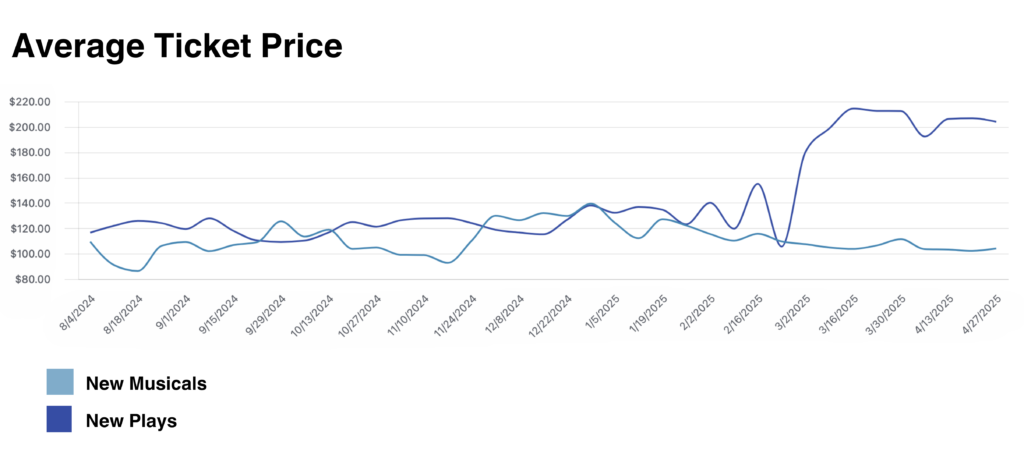
The Average Ticket Price graph shows a comparison of ATP for new musicals and plays that opened in the 2024/25 season. This week, ATP for new musicals remained at a modest $104.05, while ATP for new plays came to $203.98. A clear trend has formed in the 2024/25 season, with audiences consistently paying double the price for new plays compared to new musicals. For the seventh week in a row, the now 8 new plays in the 24/25 season have out-grossed the now 16 new musicals in the 24/25 season.
Data provided by The Broadway League Research Department.
Want to receive our exclusive box-office analysis to your inbox each week? Sign up below!
