Below, please find the Broadway Grosses for Week Ending April 20, 2025, courtesy of KGM.
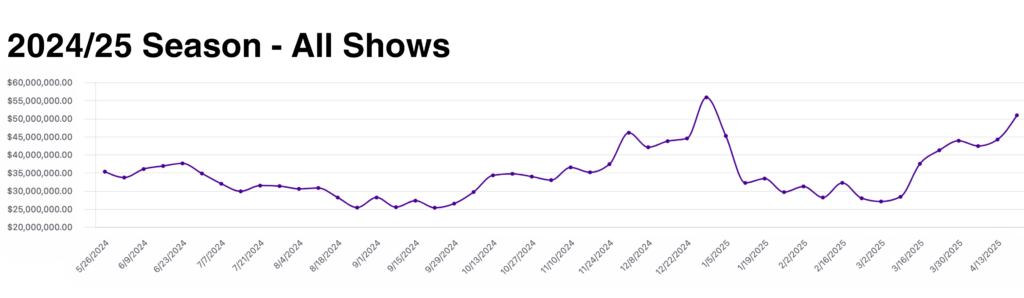
This week there were a total of 40 shows grossing $50,874,940.
Of the 374,503 seats available for purchase on Broadway this week, 357,319 or 95.4% were filled.
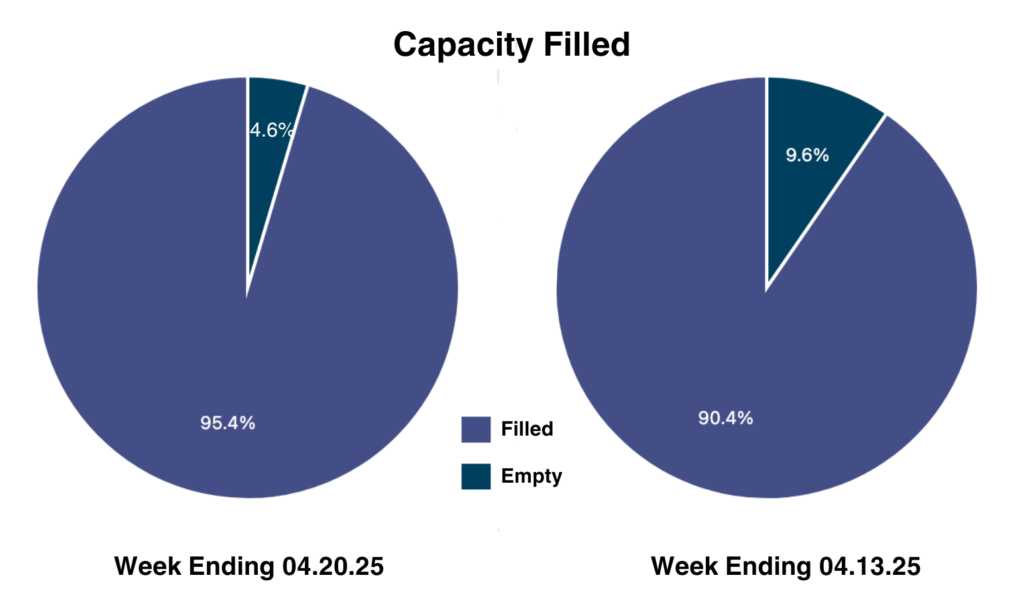
95.4% capacity filled this week, versus 90.4% last week.
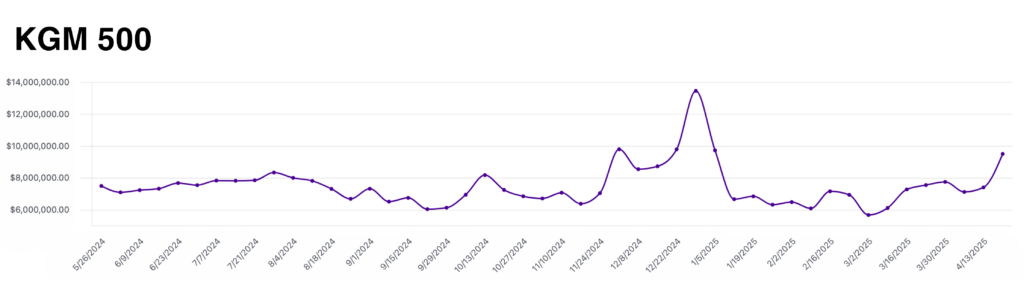
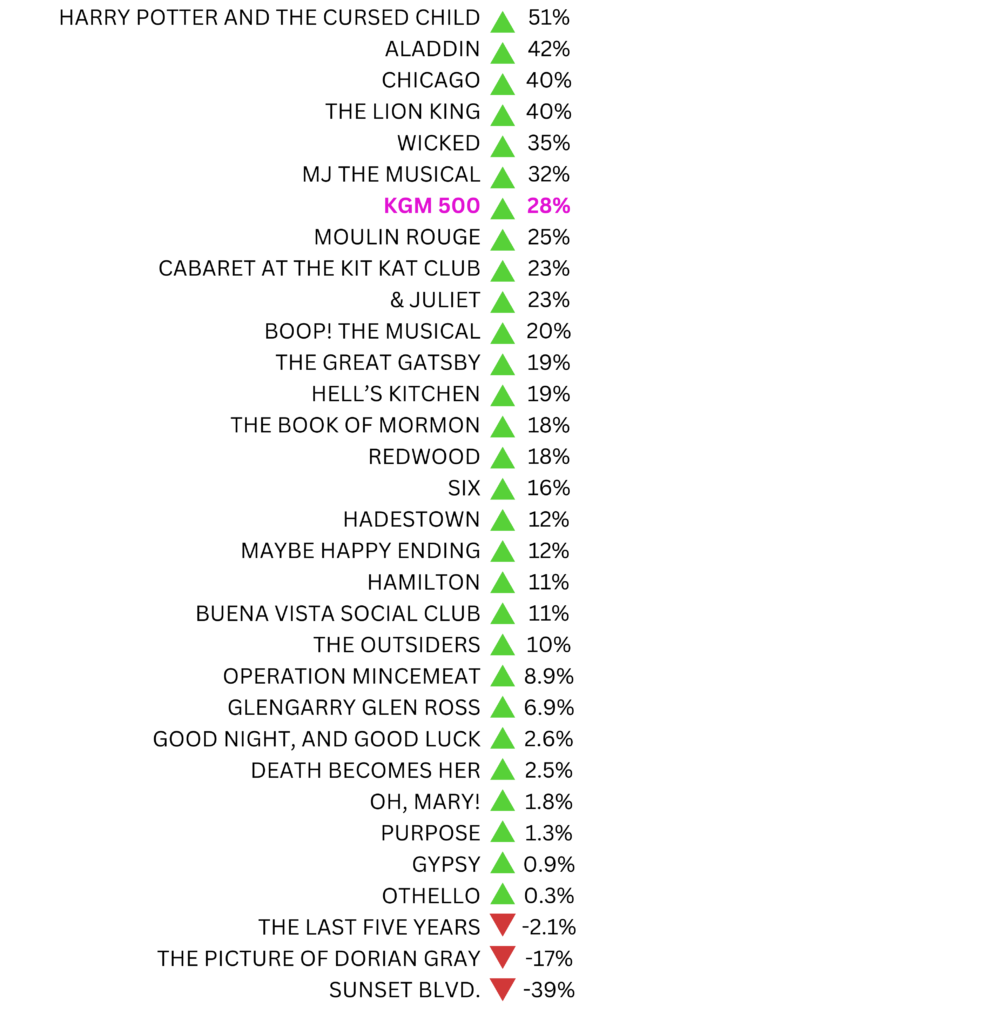
The KGM 500 is a Broadway market index used to track the overall health of the market based on the grosses of 5 long-running shows. This week, the KGM 500 climbed to $9,485,749, a 28% increase from last week’s grosses. This marks the second highest grossing week of the 2024/25 Broadway season, with multiple shows, notably The Lion King, Wicked, and Aladdin, adding extra performances to accommodate the surging audience demand over the holiday weekend. Below, you’ll find a metric to track each show’s performance in relation to the benchmark of the KGM 500.
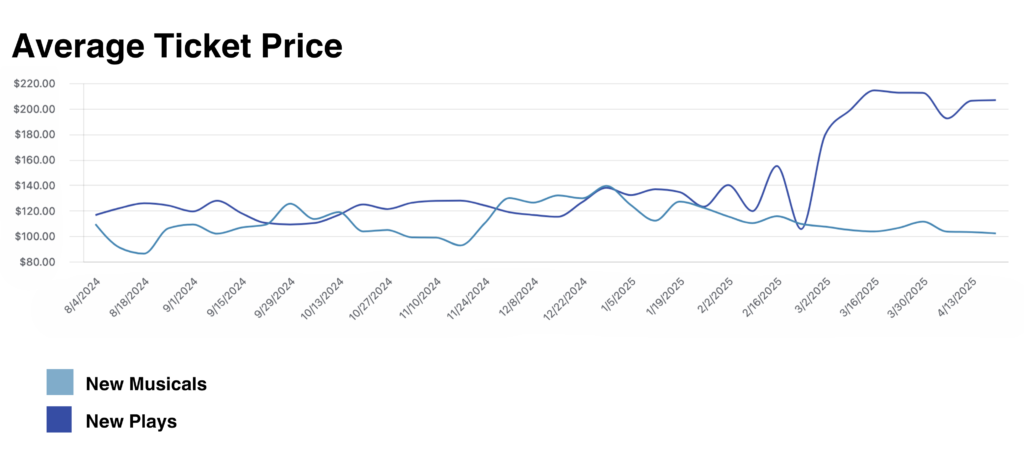
The Average Ticket Price graph shows a comparison of ATP for new musicals and plays that opened in the 2024/25 season. This week, ATP for new musicals remained at a steady $102.20, while ATP for new plays came to $206.72. For the sixth week in a row, the now 8 new plays in the 24/25 season have out-grossed the now 16 new musicals in the 24/25 season.
Data provided by The Broadway League Research Department.
Want to receive our exclusive box-office analysis to your inbox each week? Sign up below!
