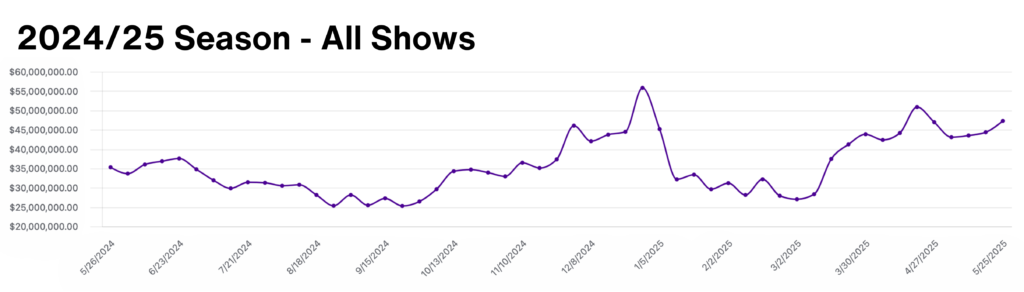
Below, please find the Broadway Grosses for Week Ending May 25, 2025, courtesy of KGM. This marks the final week of the 2024/25 Broadway season.
This week there were a total of 40 shows grossing $47,275,423.
Of the 368,964 seats available for purchase on Broadway this week, 342,076 or 92.7% were filled.
Season Totals
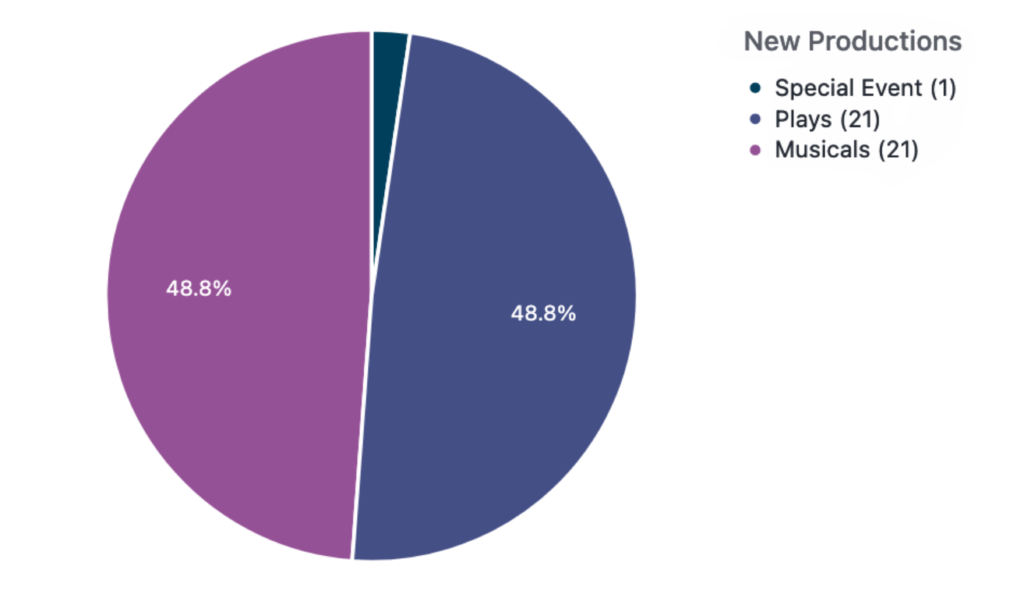
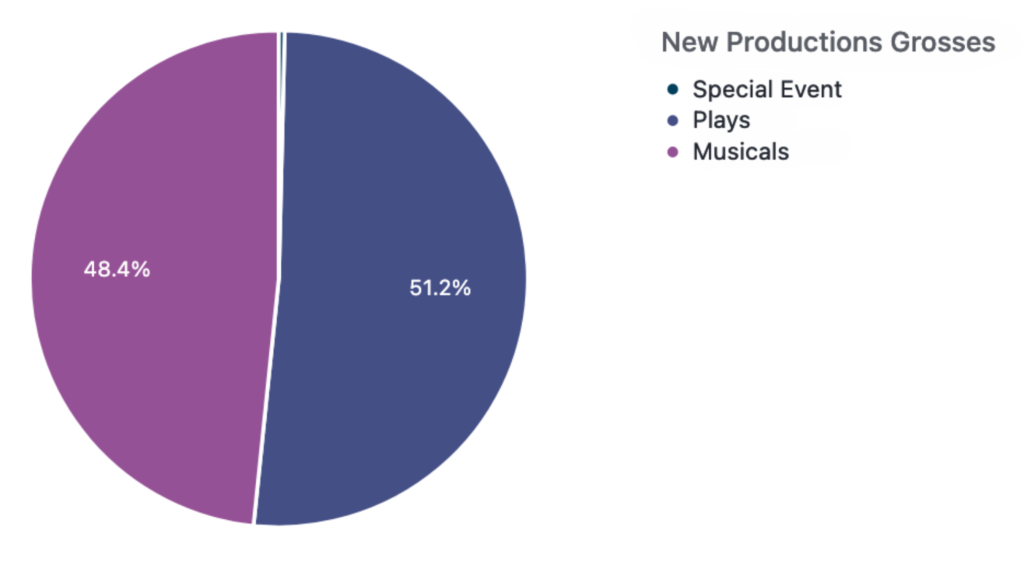
The 2024/25 Broadway season featured 43 new productions; 21 new plays, 21 new musicals, and 1 special event. In total, the 2024/25 Broadway season grossed $1,892,650,959, with new productions accounting for $568,967,577.

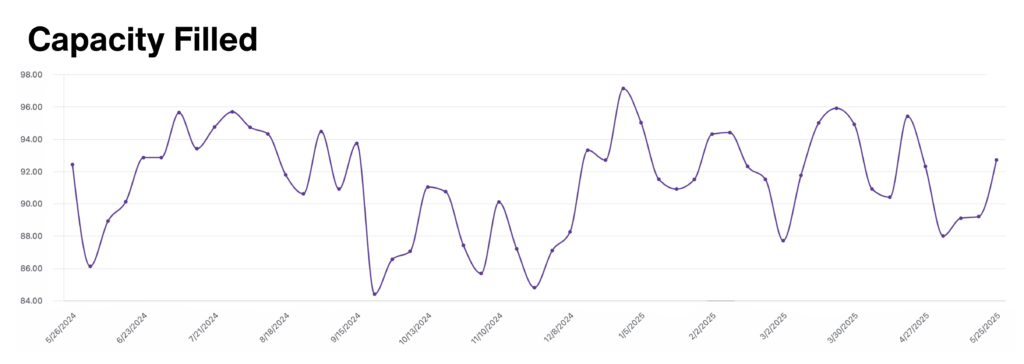
92.7% total capacity filled this week, with a season average of 91.2% filled.
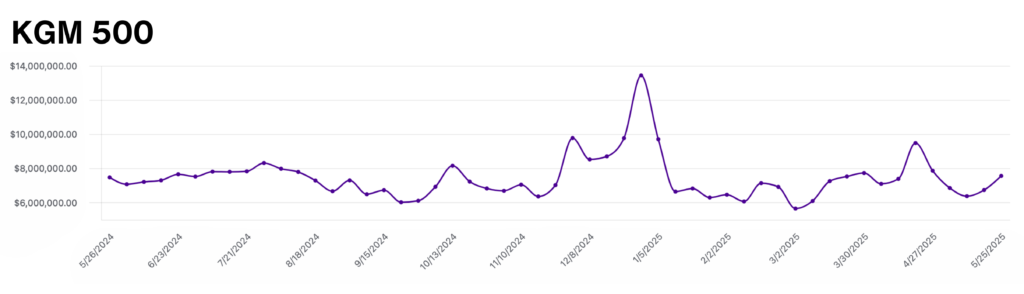
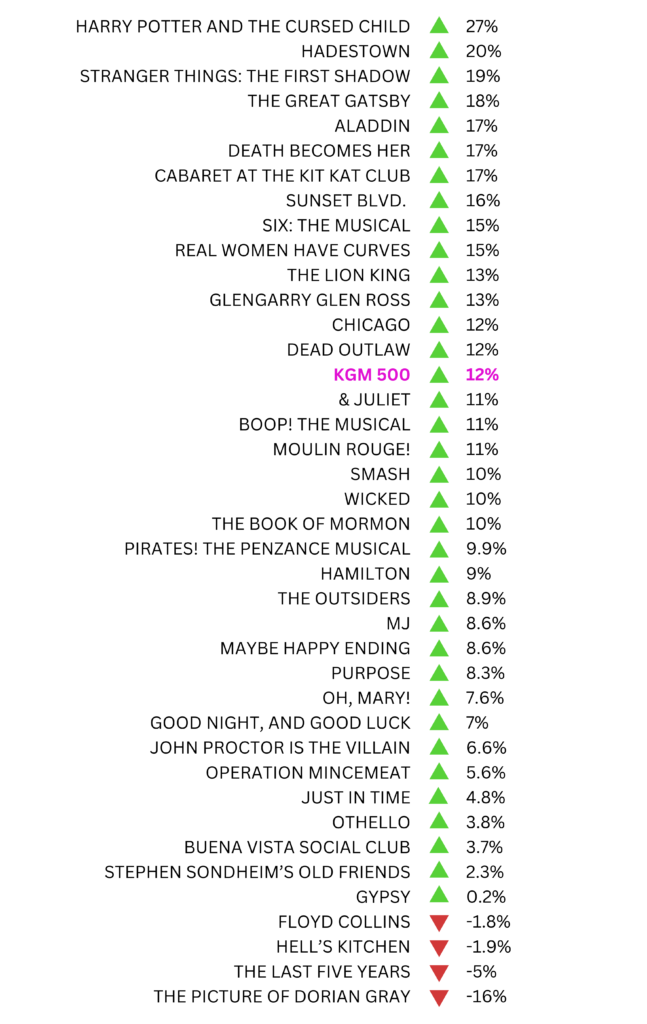
The KGM 500 is a Broadway market index used to track the overall health of the market based on the grosses of 5 long-running shows. With schools and offices closed for Memorial Day, the 2024/25 Broadway season ended on a strong week for tourism. This week, the KGM 500 rose to $7,559,146, a 12% increase from the previous week, and 1.5% higher than the season average of $7,444,854. Below, you’ll find a metric to track each show’s performance in relation to the benchmark of the KGM 500.
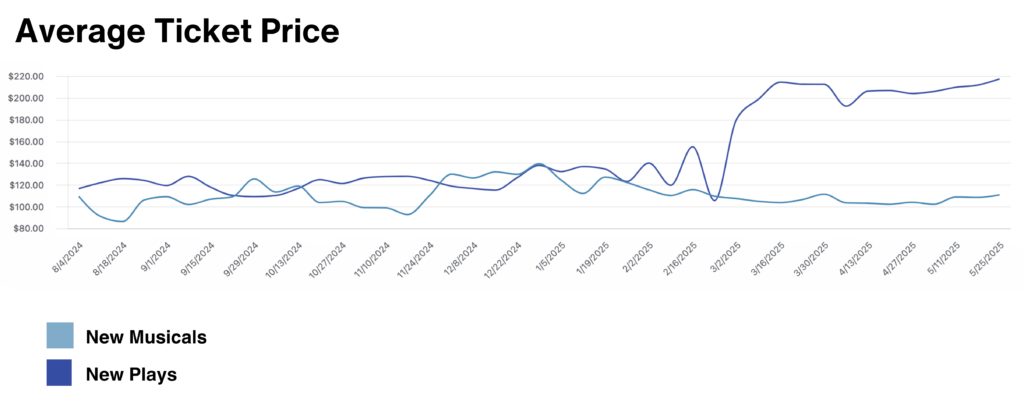
The Average Ticket Price graph shows a comparison of ATP for new musicals and plays that opened in the 2024/25 season. This week, ATP for new musicals rose slightly to $110.88, keeping consistent with the season average of $110.67 for new musicals. ATP for new plays jumped to $217.39 this week, bringing the season average for new plays up to $148.54. In an unusually strong season for plays, the new plays of 2024/24 have out-grossed the new musicals for 11 weeks in a row.
Data provided by The Broadway League Research Department.
Want to receive our exclusive box office analysis to your inbox each week? Sign up below!
