Below, please find the Broadway Grosses for Week Ending August 17, 2025, courtesy of KGM.
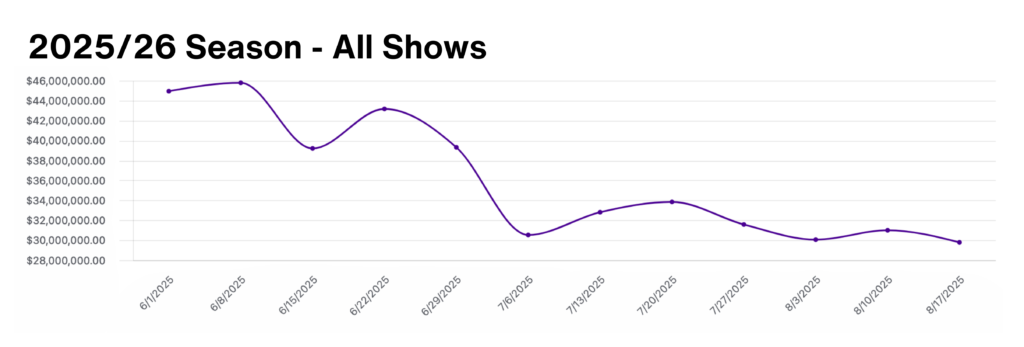
This week there were a total of 29 shows grossing $29,790,665.
Of the 279,335 seats available for purchase on Broadway this week, 245,807 or 87.9% were filled.
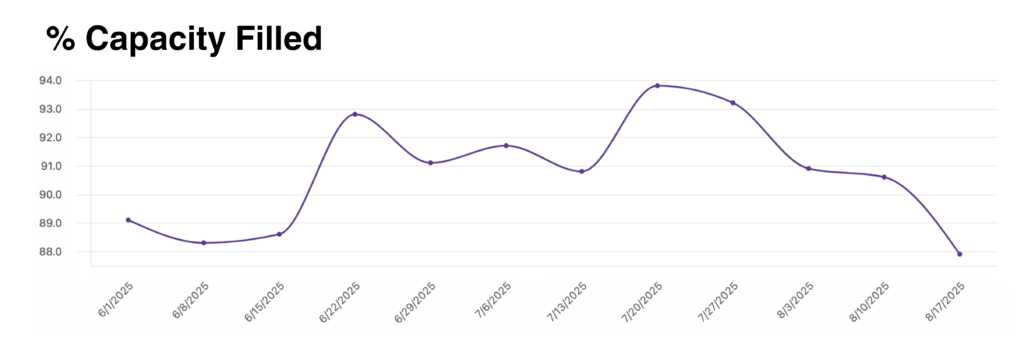
87.9% total Broadway capacity filled this week.
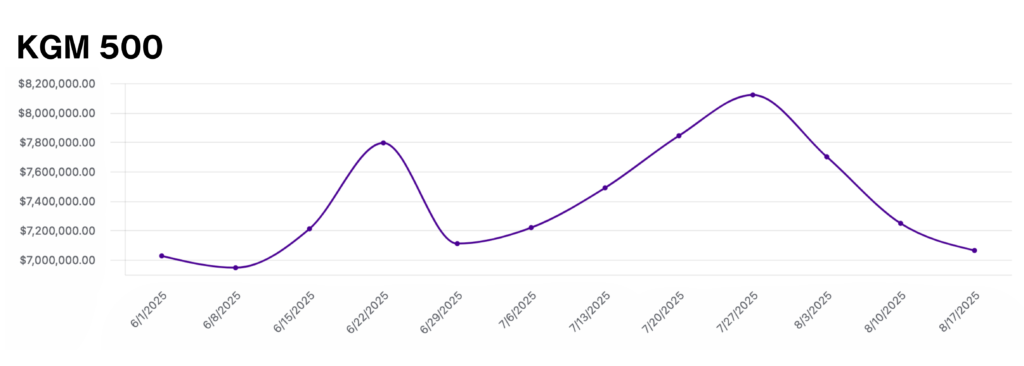
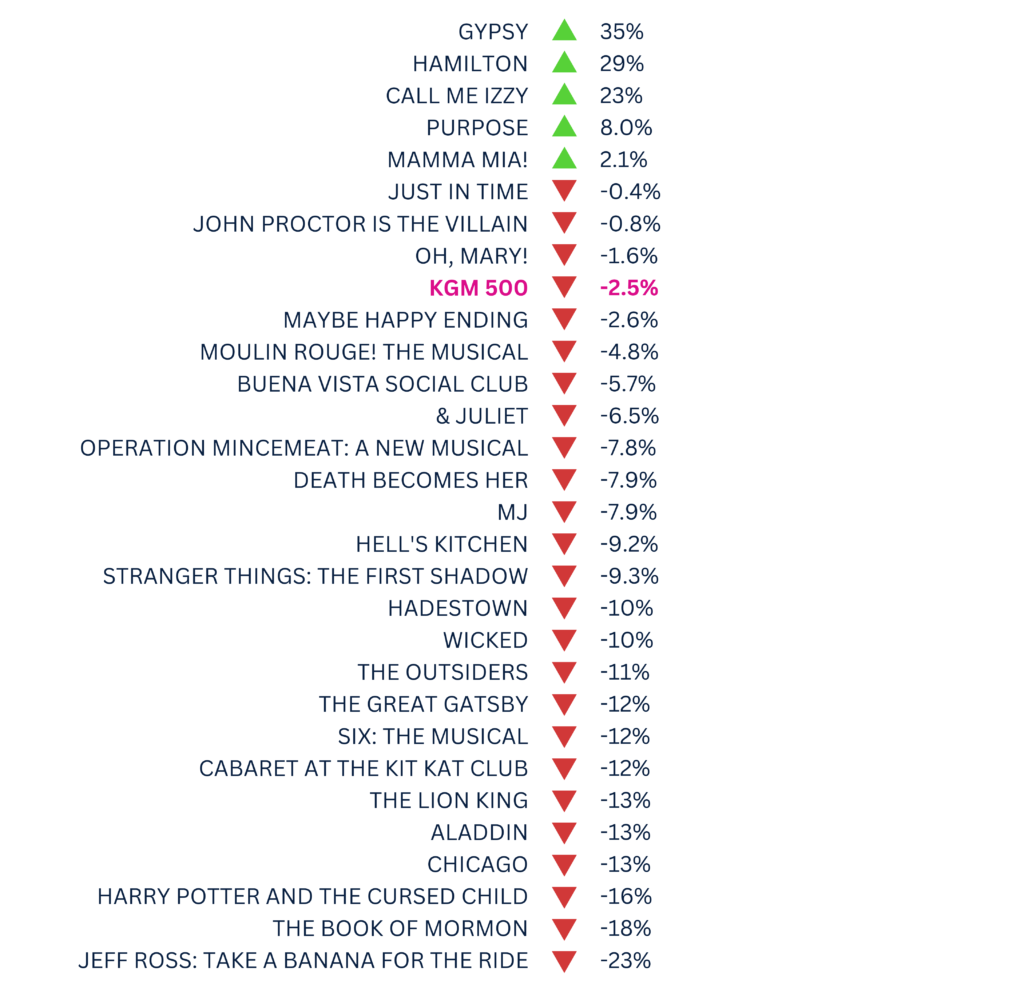
The KGM 500 is a Broadway market index used to track the overall health of the market based on the grosses of 5 long-running shows. This week, the KGM 500 dipped to $7,064,615, a 2.5% decrease from the previous week. While the end of August is a traditionally slow time for Broadway, attendance remains robust – Broadway’s collective gross softened, coming in 4% lower than the previous week, yet attendance only slipped by about 2%, and remains higher than this week last season. Below, you’ll find a metric to track each show’s performance in relation to the benchmark of the KGM 500.
This week, the average paid admission across all Broadway shows lowered to $121.19, a 1.6% decrease from last week’s average.
Data provided by The Broadway League Research Department.
Want to receive our exclusive box office analysis to your inbox each week? Sign up below!
