Below, please find the Broadway Grosses for Week Ending July 13, 2025, courtesy of KGM.
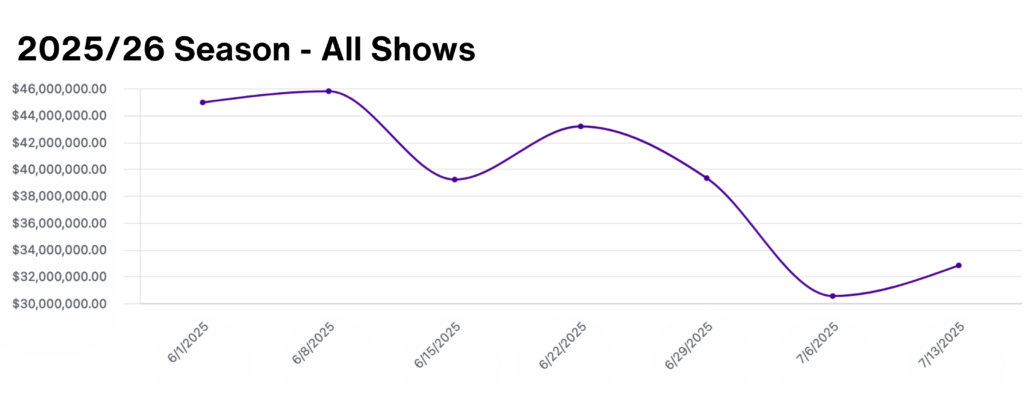
This week there were a total of 30 shows grossing $32,813,389.
Of the 287,064 seats available for purchase on Broadway this week, 260,530 or 90.8% were filled.
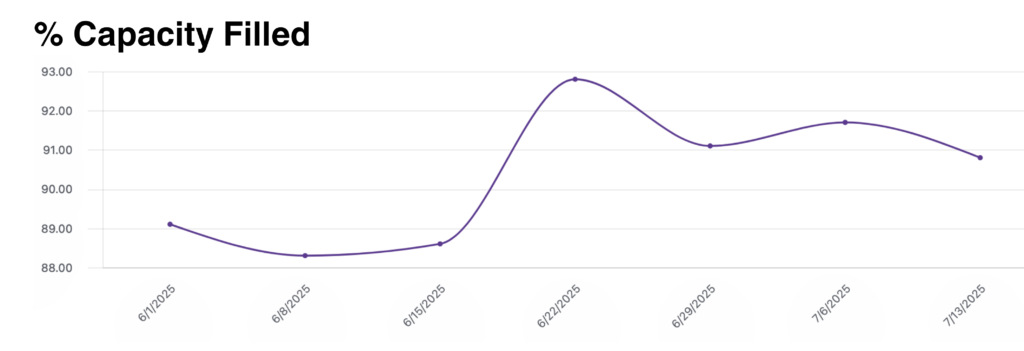
90.8% total Broadway capacity filled this week.

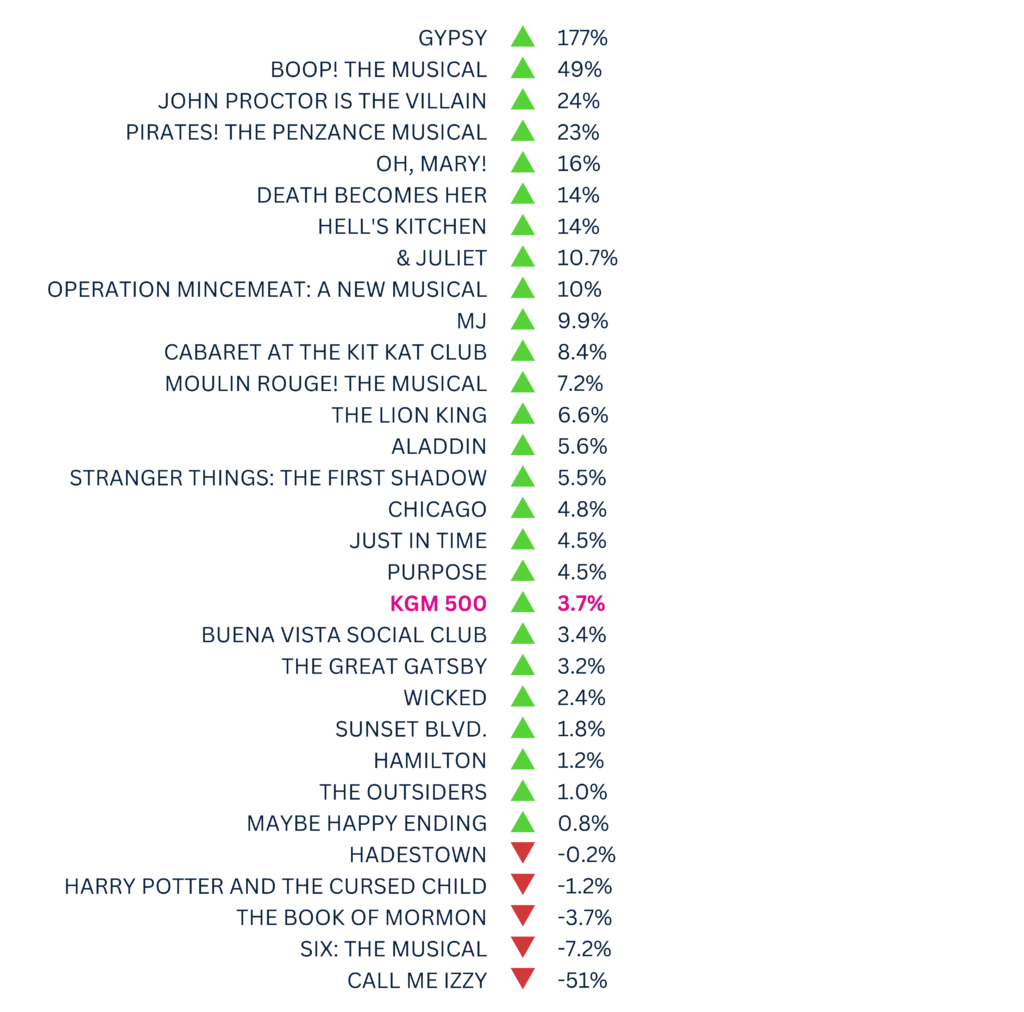
The KGM 500 is a Broadway market index used to track the overall health of the market based on the grosses of 5 long-running shows. This week, the KGM 500 rose to $7,489,613, a 3.7% increase from the previous week. Following an unusually packed July 4th weekend on Broadway, many shows are experiencing a boost as the industry ramps up for the height of the tourism season. Below, you’ll find a metric to track each show’s performance in relation to the benchmark of the KGM 500.
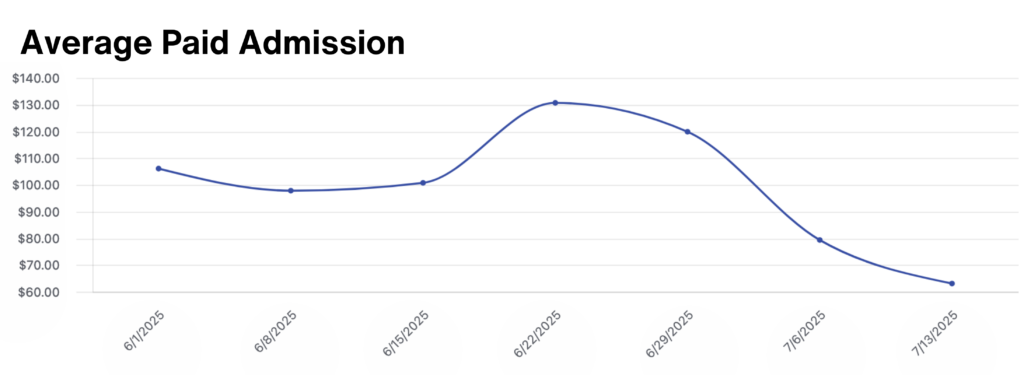
The Average Paid Admission graph shows the average price point for new shows that opened in the 2025/26 season. This week, the average paid admission lowered to $63.08, a 20% decrease from the previous week.
Data provided by The Broadway League Research Department.
Want to receive our exclusive box office analysis to your inbox each week? Sign up below!
