Below, please find the Broadway Grosses for Week Ending March 30, 2025, courtesy of KGM.
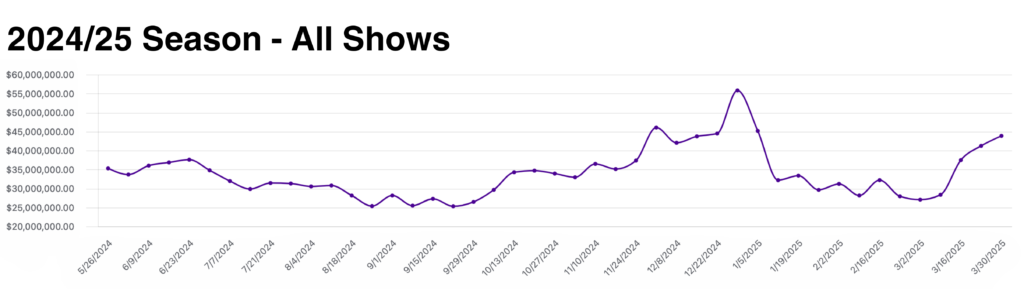
This week there were a total of 36 shows grossing $43,839,272.
Of the 328,002 seats available for purchase on Broadway this week, 311,399 or 94.9% were filled.
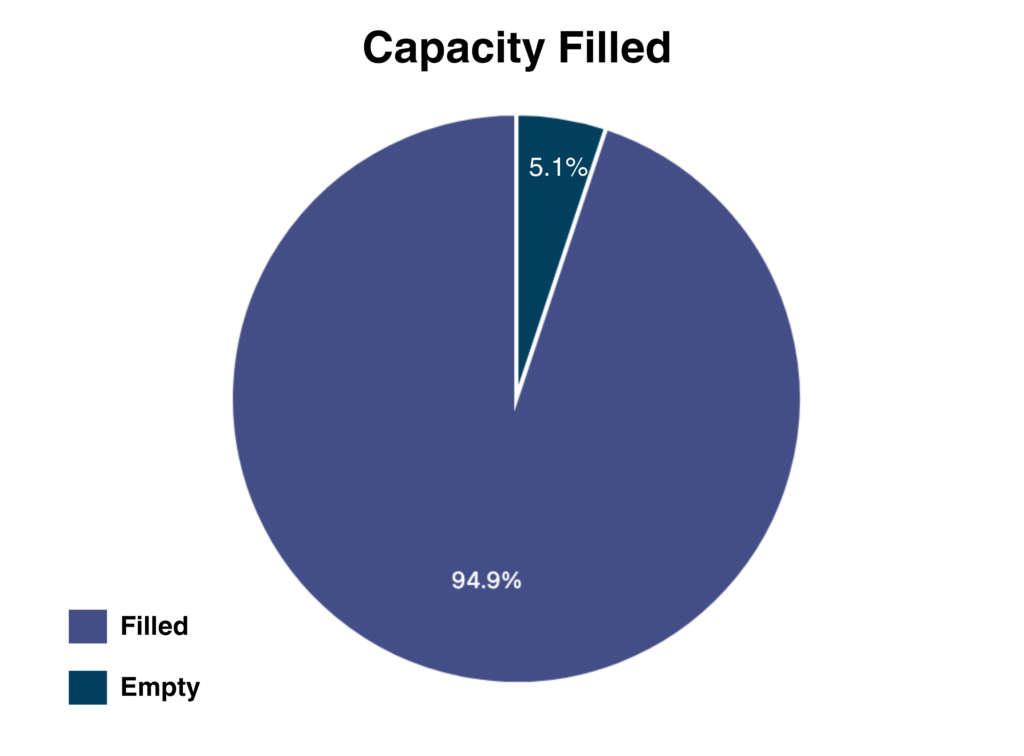
94.9% total capacity filled this week.
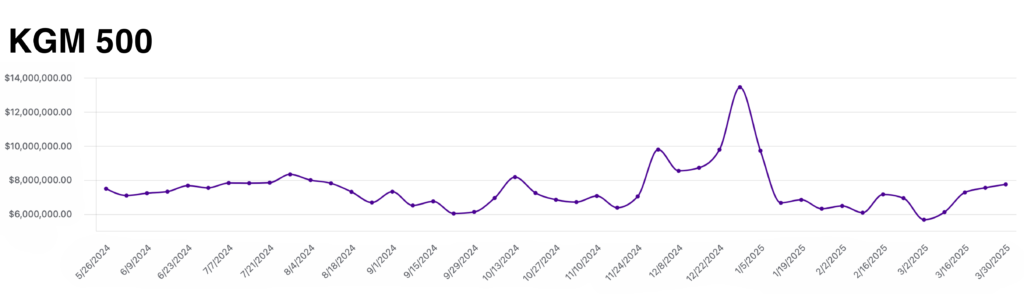
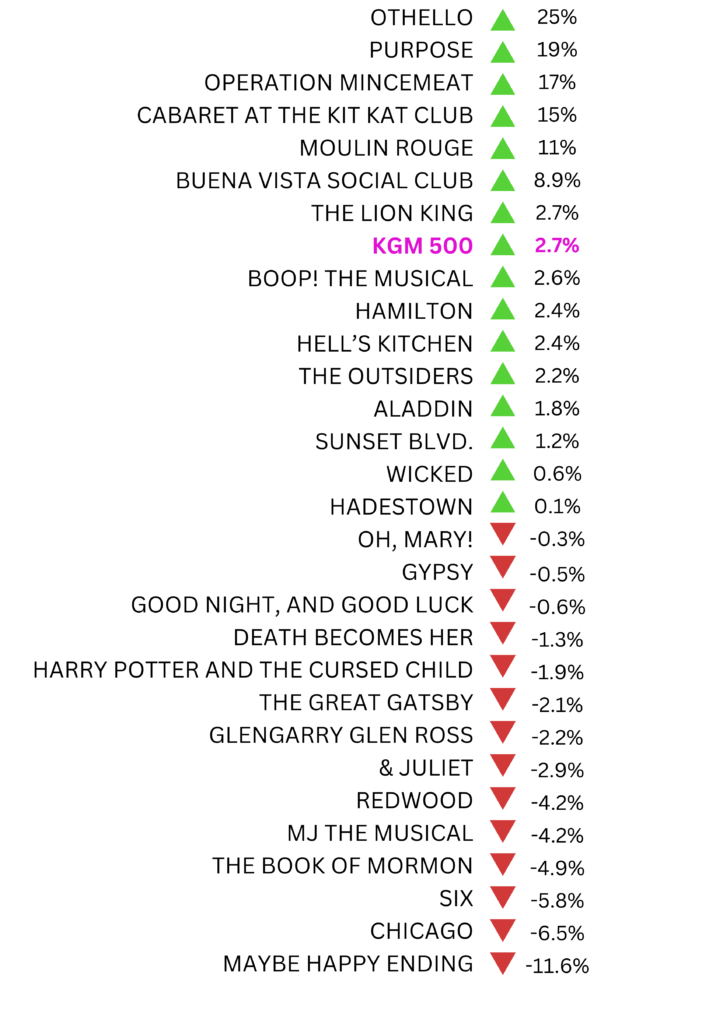
The KGM 500 is a Broadway market index used to track the overall health of the market based on the grosses of 5 long-running shows. This week, the KGM 500 rose to $7,731,236, a 2.7% increase from last week’s grosses. As the overall grosses increased 6.3% this week, this tells us that with Tony season ramping up, the buzz surrounding newer openings such as Othello, Purpose, and Operation Mincemeat are attracting more theatre-goers than some of the legacy shows. Below, you’ll find a metric to track each show’s performance in relation to the benchmark of the KGM 500.
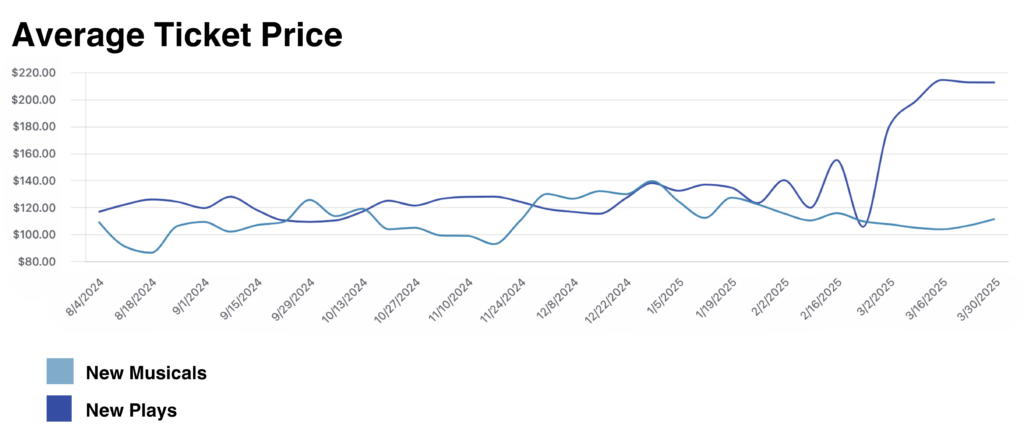
The Average Ticket Price graph shows a comparison of ATP for new musicals and plays that opened in the 2024/25 season. This week, ATP for new musicals rose to $111.43, while ATP for new plays stayed at a towering $212.48. For the third week in a row, the now 8 new plays in the 24/25 season have out-grossed the now 11 new musicals in the 24/25 season.
Data provided by The Broadway League Research Department.
Want to receive our exclusive box-office analysis in your inbox each week? Sign up below!
