Below, please find the Broadway Grosses for Week Ending March 23, 2025, courtesy of KGM.
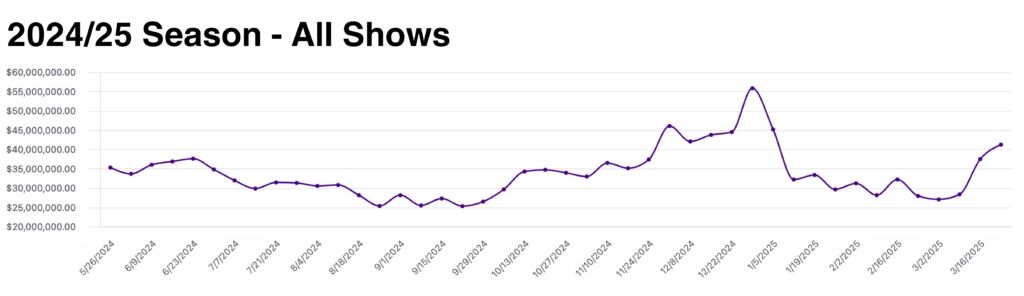
This week there were a total of 33 shows grossing $41,206,933.
Of the 311,702 seats available for purchase on Broadway this week, 299,121 or 95.9% were filled.
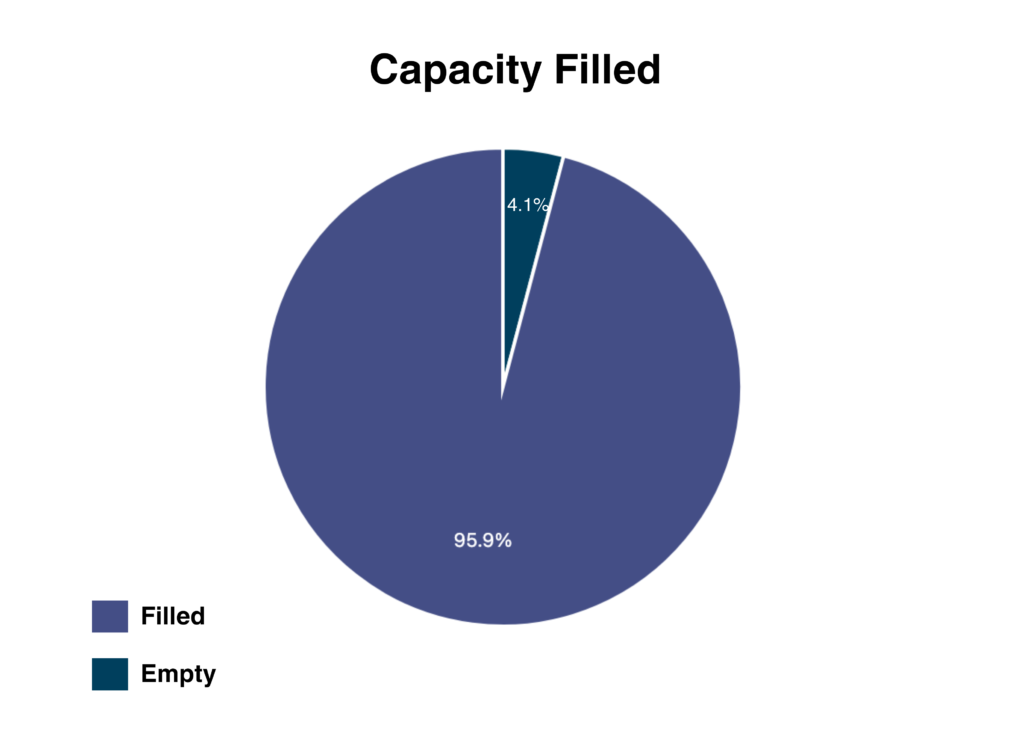
95.9% total capacity filled this week.
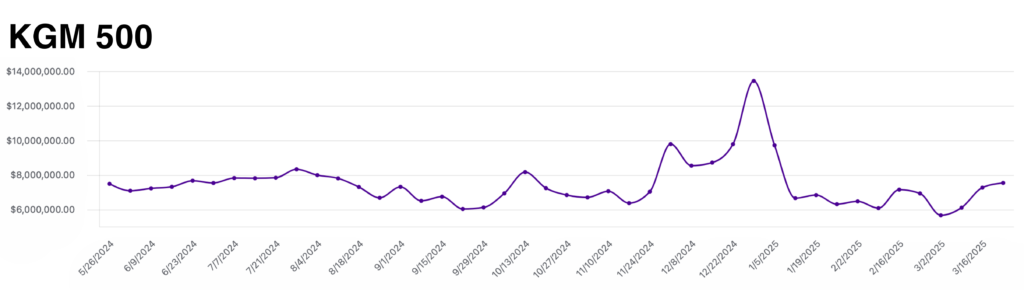
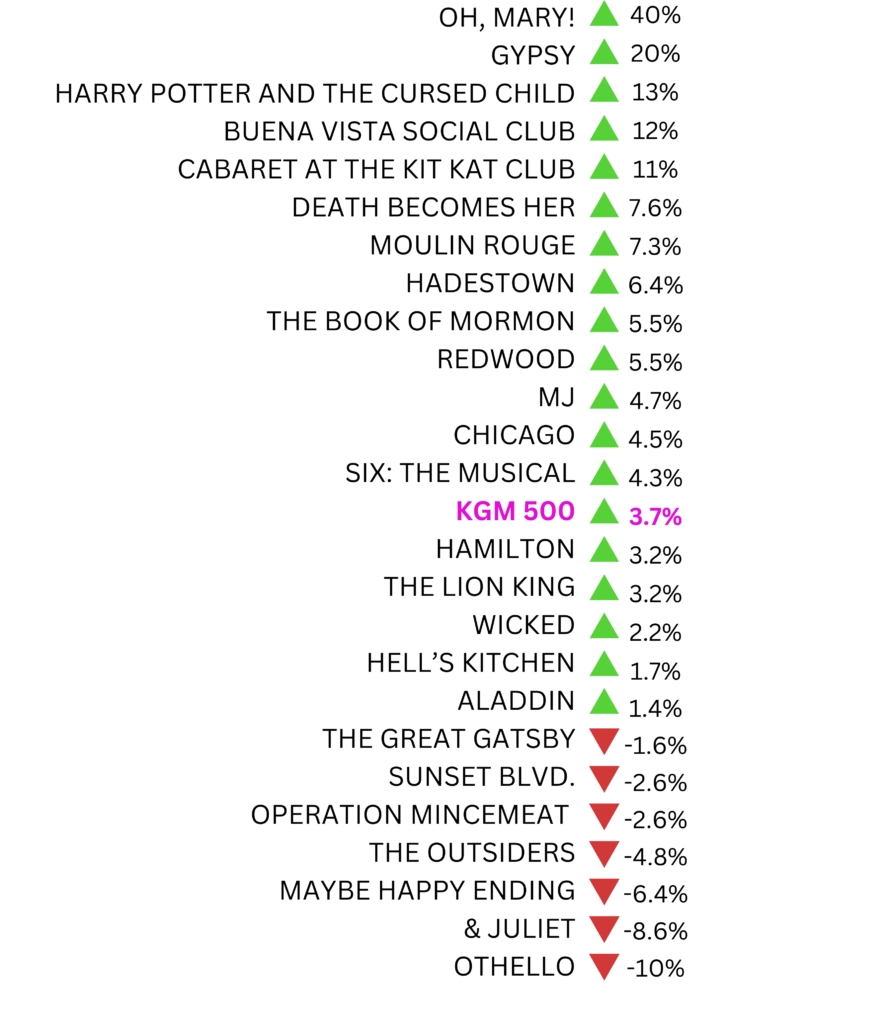
The KGM 500 is a Broadway market index used to track the overall health of the market based on the grosses of 5 long-running shows. This week, the KGM 500 rose to $7,530,673, a 3.7% increase from last week’s grosses. As audiences return for the spring Broadway season, some shows are seeing more of a boost than others. Below, you’ll find a listing comparing all shows last week in relation to the performance of the KGM 500. This is a new metric we’re adding to help track each show’s performance in relation to the benchmark of the KGM 500.
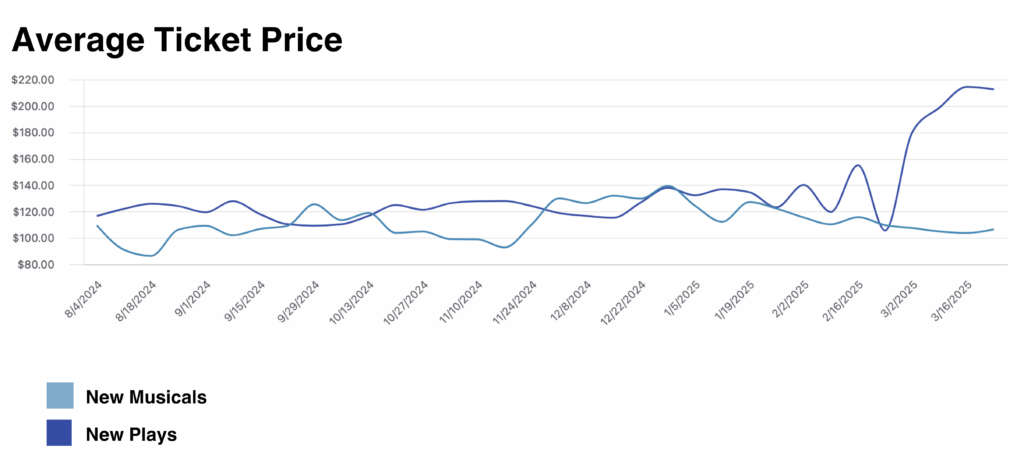
The Average Ticket Price graph shows a comparison of ATP for new musicals and plays that opened in the 2024/25 season. This week, ATP for new musicals came to $106.48, while ATP for new plays continues to sit at a lofty $212.57. On average, audiences are paying double the price for new plays, while the 7 new plays outgrossed the 10 new musicals this past week.
Data provided by The Broadway League Research Department.
If you’d like to receive our exclusive box-office analysis to your inbox each week, sign up below!
